News
.png)
May 25, 2026
Service Solutions Update to Version 2026.2
In the 2026.2 release of our service solutions lineup (FastReport Cloud, FastReport Publisher, FastReport Corporate Server), we focused on improving reliability and usability.

May 19, 2026
Release of Version 2026.2 for FastReport Online Designer
The new FastReport Online Designer version (2026.2) brings significantly improved UI and a reworked theming system, a new report workspace, and a substantial amount of new functionality. Among the key changes are a fully redesigned theme matching the FastReport .NET Avalonia look, a new docking manager for flexible panel layout, a designer settings pop-up, an improved undo/redo system, and much more.
New Features
FastReport .NET Avalonia theme
In version 2026.2 the look of Online Designer has been completely reworked — a new theme matching the FastReport .NET Avalonia style has been added. Styles for all controls, panels, popups and toolbars have been updated.
The theme is responsive and renders correctly on screens of various sizes.
Redesigned properties panel
The properties panel got a refreshed design in the form of a property grid.
The properties panel is now merged with the events panel into a single interface, just like in the desktop version of FastReport. Switching between component properties and events is done via a toolbar inside the panel, without having to look for events in a separate window.
Docking manager
A new docking manager has been implemented, allowing users to flexibly arrange panels in the designer interface.
Panels can be dragged, docked to different sides of the screen and resized.
New workspace: rulers, guides, band headers
The designer workspace has been fully reworked. Rulers and guides have been updated — they now reflect the position of components on the page more accurately and remain readable at any zoom level. Band headers have been moved to a separate layer.
In addition, an alternative grid is supported when the Alt key is pressed — components can be moved and resized with a smaller step for the most precise positioning.
Toolbars for the Data and ReportTree panels
The "Data" and "Report tree" panels have received toolbars with features from FastReport .NET. You can collapse and expand nodes, use drop-down lists, and create new relations. The panels support recursive collapse/expand of nodes, as well as automatic switching to the neighboring item when a node is deleted.
Designer settings window
A unified designer settings window has been added, combining configuration of appearance, object parameters and ways of interacting with the application. The following sections are available:
Interface — hotkey and autosave settings
Report page — grid and measurement-unit settings
Object appearance — styles and display of components
"Code" page — code page settings
"FRX" page — settings for the FRX template editor
The settings are saved when the designer is closed and restored on the next launch.
Barcode editor window
A dedicated window has been implemented for configuring the barcode component, replacing the previous generic expression editor. The window contains separate tabs for each barcode type with the corresponding configuration fields, including Swiss QR.
Font editor window
The font configuration window has been reworked — its look and structure are now aligned with the FastReport .NET design.
The window replaces the previous simplified version and provides access to the full set of font parameters.
FRX template editor
A built-in editor for the report's XML template (FRX) has been added. The editor with syntax highlighting allows you to view and edit the report structure directly in XML form. Undo/redo is supported, as well as synchronization with the main designer view.
Format painter
You can now copy and paste styles between components. This is an analog of the "Format painter" tool from the desktop version, available from the toolbar. The feature lets you quickly apply font, color, border and other formatting settings to various components in the report.
New shape drawing logic
Drawing logic for the PolyLine, Polygon and line components has been reworked. In this version, drawing is interactive, without having to switch tools manually. Presets for quickly adding common shapes have been added to the components panel.
New logic for adding components to a page
The mechanism for adding components has been reworked to match the desktop FastReport .NET. A component is now added by clicking the components panel — the cursor then enters placement mode and shows a preview of the future component under it. A second click on the page creates the component at the preview position.
"Open report" and "Save report"
Open and save report functionality is now available. You can open a report from your local file system directly in WebReport without uploading it to the server. You can also save a finished report to your local file system.
Note: before using these functions, the data sources must be configured in WebReport.
Improvements
Undo/Redo: named actions and group undo
The undo/redo system has been extended to the code editor and the FRX template editor. Each action in the application now has a textual description, so the change history no longer contains anonymous entries. You can visually select and undo several actions at once with a single click.
Code editor improvements
Configurable indentation has been added to the report script editor. The indent size is now set in the code editor page settings.
UI adaptability
The designer interface has been adapted to screens of various sizes in both themes — Avalonia and the classic one. UI elements scale and rearrange when the browser window is resized.
Pages panel improvements
The pages panel has been improved with the ability to create both regular and dialog pages. A left click on the "+" button creates a regular page. A right click opens a context menu with options to create either a dialog page or a regular report page.
New UI element for selecting a data source
A new control has been added for selecting a data source, modeled after the desktop FastReport .NET. Instead of typing a table or field name into a text box, the user is now presented with a tree of connections, data sources and columns — the value is picked with a single click.
The control is used in two modes:
Selecting a data source for a band — in the band editor (the "Data source" tab) only tables are available for selection.
Selecting a data field for a component — for example, in the "Data column" tab of the Picture editor: the tree shows tables and their columns, and the user can either pick a specific field or reset the value to None.
Editing an existing connection
It is now possible to edit a previously created data source connection — open its connection-string parameters, adjust them and save, without recreating the connection from scratch.
For security reasons the connection string is not stored in the report itself and lives only in the browser memory of the current designer session. Therefore editing is available under the following conditions:
the connection was created within the current session, and the designer page has not been reloaded since;
the report has not been reopened after the connection was created.
After a page reload or after the report is reopened the designer loses the connection string and editing becomes unavailable — in this case the connection has to be created again.
Bug Fixes
Fixed problems with saving Cyrillic characters in script code (VCL)
Fixed an issue where Cyrillic characters in script code were not saved correctly in VCL reports.
Fixed VisibleExpression property (.NET)
Fixed an issue where the VisibleExpression property was missing from the properties panel of the text component. The property is now displayed correctly.
Fixed an error when using fill on ShapeObj (.NET)
Fixed an error that occurred when trying to apply a fill to the ShapeObj component. The fill setting now works correctly.
Fixed: identical table names when connecting to JSON (.NET)
Fixed an issue where multiple JSON connections produced tables with identical names. Each connection now gets a unique table name.
Fixed an error when opening a report with an advanced matrix (.NET)
Fixed an error that occurred when opening a report containing a heavily populated advanced matrix (AdvMatrix). With a large number of fields, the report now opens without errors.
Fixed: text color was lost when reopening a report (.NET)
Fixed an issue where a modified text color in a TextObject was correctly saved but did not appear after reloading the page in design mode. Text color is now saved and restored correctly.
Fixed an error when using axis formatting in MsChart (.NET)
Fixed two issues with the MsChart component: the format of the Y-axis labels was not preserved when the report was reloaded, and trying to prepare a report with the newly applied format produced an error for the user.
Fixed: Undo/Redo buttons were unavailable until the first object was added (.NET, VCL)
Fixed an issue where the Undo and Redo buttons remained disabled after a report was loaded, even if the user modified bands or moved existing objects. The buttons only became active after a new object was added to the page. The change history is now tracked correctly from the very first action.
Fixed an error when copying a page containing AdvMatrix/Matrix/Table (.NET)
Fixed an error that occurred when trying to copy a report page containing AdvMatrix, Matrix or Table components.
Fixed: report layout was broken on save (.NET)
Fixed a critical error reproduced when saving reports that used tables for layout.On save, the table width was incorrectly truncated, breaking the report layout.
Fixed: currency format was missing from the locale (.NET)
Fixed an issue where the currency format was missing from the numeric data formatting dialog.
Fixed: built-in PadLeft function did not work (.NET)
Fixed an issue where the PadLeft function worked correctly in the desktop version but did not work in Online Designer when preparing the report through WebReport.
Fixed an error when preparing a report with DataType="System.Guid" (.NET)
Fixed an error that occurred when trying to prepare a report containing a field with the System.Guid data type.
Fixed problems when creating a Postgres data source (.NET)
A series of issues with PostgreSQL connections has been fixed: correct conversion of quotes in XML for TableName and SelectCommand has been added, duplicated procedures when adding a parameter have been fixed, as well as the loss of a parameter type when switching to preview.
Fixed: style name was not changed in the styles editor (.NET)
Fixed an issue where changes to a style name in the styles editor were not saved. After closing and reopening the popup, the style was still displayed with the original name (for example, "Style1").
Fixed method replacement in scripts (VCL)
Fixed an issue where creating several event handlers for the same component sequentially caused a new handler to overwrite the previous one. For example, creating OnAfterPrint after OnAfterData removed the code of the first handler.
Fixed band sorting (VCL)
Fixed an issue where band sorting in VCL solutions did not work correctly.
Fixed "Data format" dialog and conditional highlighting (VCL)
A set of issues with the text component in VCL has been fixed:
the "Data format" dialog could not be edited if the text was not an expression;
incorrect text positioning logic in a multi-line component has been fixed.
Fixed Undo/Redo behavior when adding components to a band (VCL)
Fixed an issue: when adding a component to a narrow band (which auto-expanded), pressing Undo removed the component but did not restore the band to its original size. A subsequent Redo had no effect.
Fixed: "Fields" tab of a detail table did not open in the "Relations editor" (.NET)
Fixed an issue where the "Fields" tab of a detail table did not open in the "Relations editor" when creating relations between tables of an MS SQL connection.
Fixed empty drop-down for the BreakTo property (.NET)
Fixed an issue where the drop-down list of the BreakTo property in the TextObject properties panel was empty and offered no value to choose.
Full list of changes
New functionality
+ FastReport .NET Avalonia theme+ New properties panel+ Docking manager for all panels+ New workspace: reworked rulers, guides and band headers+ Toolbars for the Data and ReportTree panels+ Designer settings popup (appearance, objects, interaction)+ Barcode editor popup+ Font editor popup+ FRX report template editor+ Format painter+ New shape drawing logic (PolyLine, Polygon, lines) and presets+ New component placement logic with preview+ "Open report" and "Save report" functions
Improvements
+ Undo/Redo with named actions for the code editor and FRX+ Configurable indentation in the code editor+ UI adaptability for all screen sizes (both themes)+ Pages panel improvements+ New control for selecting a data source in the band and component editors (data tree, like in the desktop)+ Editing of a previously created data source connection (within the current browser session)
Bug fixes
- Fixed problems with saving Cyrillic characters in script code (VCL)- Fixed VisibleExpression property (.NET)- Fixed an error when using fill on ShapeObj (.NET)- Fixed: identical table names when connecting to JSON (.NET)- Fixed an error when opening a report with an advanced matrix (.NET)- Fixed: text color was lost when reopening a report (.NET)- Fixed an error when using axis formatting in MsChart (.NET)- Fixed: Undo/Redo buttons were unavailable until the first object was added (.NET, VCL)- Fixed an error when copying a page containing AdvMatrix/Matrix/Table (.NET)- Fixed: report layout was broken on save (.NET)- Fixed: currency format was missing from the locale (.NET)- Fixed: built-in PadLeft function did not work (.NET)- Fixed an error when preparing a report with DataType="System.Guid" (.NET)- Fixed problems when creating a Postgres data source (.NET)- Fixed: style name was not changed in the styles editor (.NET)- Fixed method replacement in scripts (VCL)- Fixed band sorting (VCL)- Fixed "Data format" dialog and conditional highlighting (VCL)- Fixed Undo/Redo behavior when adding components to a band (VCL)- Fixed: "Fields" tab of a detail table did not open in the "Relations editor" (.NET)- Fixed empty drop-down for the BreakTo property (.NET)

May 18, 2026
-15% Off Single Licenses for Independent Developers
Freelancers’ Day is a great occasion to celebrate individual developers.
From May 18 to May 22, get 15% off Single licenses for:
— FastReport .NET— FastReport VCL— FastReport Desktop
If you work independently, manage projects, build products, and solve complex challenges every day on your own, this offer is for you.
FastReport itself once started as a tool created by an independent developer. And today, we continue to support those who move the industry forward with their ideas, expertise, and code.
Get your license with a discount before May 22!

May 14, 2026
May 14 is Freelancers’ Day
And it’s a great occasion to say that independent developers are a real driving force of the industry.
Freelancers are often the ones who take on everything at once: development, architecture, client communication, deadlines, and project support. Without large teams, but with a huge amount of responsibility and expertise.
Being an independent developer does not mean “working alone.” It means being brave, flexible, and continuously moving projects forward with your own skills and effort.
FastReport itself once started as a project by an individual developer. From a single idea, relentless work, and a desire to build a convenient tool for other programmers.
Over time, it has grown into a product used by developers around the world, but we still feel especially close to the philosophy of independent development and the people who build great things on their own.
Join the FastReport user community today to create powerful software products together!
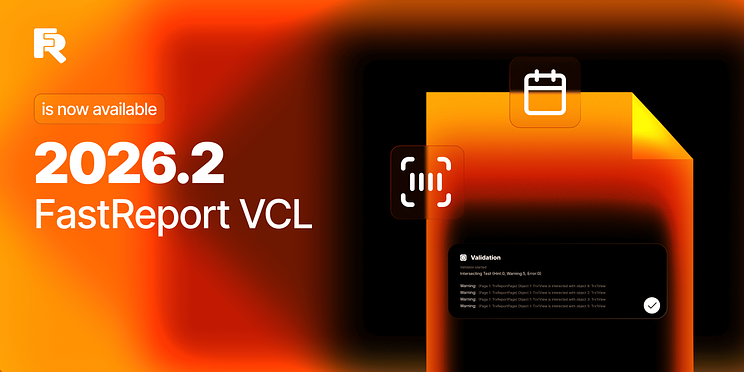
April 21, 2026
Overview of Update 2026.2 for FastReport VCL
Version 2026.2 of the FastReport VCL introduces 10 new UI components for Delphi and Lazarus, an updated FastGrid with nested groupings, a report validation system, and a property for managing band column layout (TfrxDataBand.BandColumns.Layout). New features include a center-align mode for containers, the UseSizeConstraints property for tables, image post-processing effects, and the ability to preserve original image links during export. Improvements have also been made to FastReport FMX, FastCube, and FastQueryBuilder.
New UI Components (Editors) for Delphi and Lazarus
The component base has been expanded with 10 new UI editors: TfrBarcode, TfrButtonEdit, TfrCalendar, TfrCheckBox, TfrComboBox, TfrCurrencyEdit, TfrEdit, TfrImage, TfrMaskEdit, TfrSpinEdit. The main difference between our UI components and the standard ones is their additional display and control settings.
TfrBarcode — embed all available linear and 2D barcodes from the FastReport suite into your non-reporting application.
TfrCalendar — use a calendar with an extended set of settings.
TfrMaskEdit — add edit fields with complex masks to your application.
TfrCurrencyEdit is a currency display editor that is essential for any modern business application.
Try our editors in your application.
FastGrid Has Received a Major Update
The update introduces the ability to create nested groupings within the grid. You can now easily collapse and expand groups. Creating groups is now easier—just drag a field into the grouping area. Each field type has its own editor. FastGrid uses all available UI editors for editing fields.
You can also quickly export data as reports in any format using FastReport.
Check out the new UI component functionality in our demo app.
New Features of FastReport VCL
Report Validation System
Before saving, check your reports for errors, following development guidelines. Implement a report validation system in your CI/CD. The new system allows you to validate reports both from the designer and from code. Its flexibility allows you to add your own validation rules—whether it's checking for correct object naming or ensuring compliance with corporate style guidelines in report templates.
The validation system contains a set of validation rules: object intersections, conflicting properties, data sets, expressions, empty objects, and report scripts. You can prevent users from saving reports that fail validation.
Read more about the report validation system in our article.
New Property for Managing the Arrangement of Band Columns
The report engine now allows you to control the layout of band columns using the TfrxDataBand.BandColumns.Layout property. This property allows you to select the column display order: first to the right, then down (AcrossThenDown) or first down, then to the right (DownThenAcross). In DownThenAcross mode, you can set the maximum number of rows in a column using the MaxRows property. The average value of the total number of records is used by default.
New Alignment Mode
In this 2026.2 update, we've added a container center alignment mode that uses not only the width but also the height of the baHVCenter.
UseSizeConstraints: New Property for Tables
UseSizeConstraints property has been added to table columns and rows. This property allows you to set maximum and minimum width and height dimensions not only when creating a report, but also when designing and resizing a table. This property is useful for creating fixed rows and columns when stretching a table to the full-page width (using FitPartsToPageWidth or Align).
New Image Effects
The redesigned image output now includes a post-processing pipeline. This enabled adding new post-processing properties for the TfrxPictureView object: Transparency for setting a translucency mask; image rotation; and mirroring.
Export Improvement: Retaining Original Image Links
The latest version of our export tool adds a new feature to preserve the original image links specified in the DataLink.Link property. This functionality allows users to more flexibly manage the export process and ensures that all necessary data is preserved.
This process is controlled by the dltOnExport flag for the LoadType property and the ExportDataLinksMode property for all export filters. Exports can now operate in three modes:
edmNone (default)—exports only what is loaded into the image object.
edmLoadToObject—when exporting to an object, data is loaded from a link and then exported.
edmInternalExport—HTML exports use the original link specified in the DataLink.Link field.
This feature greatly simplifies data export and allows you to preserve all important image links, which is especially useful when working with large amounts of data and complex projects.
FastReport FMX, FastCube, and FastQueryBuilder Improvements
FastReport FMX now allows you to print reports with the Skia Canvas function on Windows platform in RAD Studio 13.
The TfcxSliceGridToolbar.AutoExpandPopups property has been added to FastCube for automatic group expansion. The CrossView and ChartView editors have been updated and improved for integration with FastReport.
FastQueryBuilder now supports escaping of fields and tables for different SQL dialects.
In addition to these changes, the products include many improvements and fixes. See the full list of changes.
Version 2026.2.0
VCL.Core---------------[Engine]- fixed CSS error handling in HTMLView
[Graphic]- fixed EPNGOutMemory error when scrolling images- fixed output of transparent SVG in TfrxPictureView- fixed SVG transparency - fixed AV occurring when a TfrxSVGGraphic object is destroyed- fixed TfrxPictureView error with SVG
[Localization]* updated Portuguese resources* TfrLocalizationController.Language property was made case-independent
Lazarus.Core---------------[Engine]- fixed CSS error handling in HTMLView
[Graphic]- fixed EPNGOutMemory error when scrolling images- fixed output of transparent SVG in TfrxPictureView- fixed SVG transparency - fixed AV occurring when TfrxSVGGraphic object is destroyed.
[Localization]* updated Portuguese resources* TfrLocalizationController.Language property was made case-independent
VCL.Controls---------------[Engine]+ added CTRL+(Up/Down/PageUp/PageDown) handling to the Memo family
[UI]* improved Gutter and Footer handling for the Memo family - fixed AV when collapsing nodes after the tree is fully expanded- fixed incorrect rendering of HotTrek and Select when using themes in TfrTreeView- fixed a TfrTreeView bug where multiple selections were not cancelled by clicking on an unselected node.- fixed incorrect colors of tooltip text and node highlighting when using themes in TfrTreeView
Lazarus.Controls---------------[Engine]+ added CTRL+(Up/Down/PageUp/PageDown) handling to the Memo family- fixed AV in the Linux console application
[UI]* improved Gutter and Footer handling for the Memo family - fixed AV when collapsing a node after the tree is fully expanded- fixed a TfrTreeView bug where multiple selections were not cancelled by clicking on an unselected node.
VCL.FastScript---------------[Engine]- fixed FastScript ClearLocalVars for an array of variants- fixed fvtInt 64 support
[RTTI]+ added WeekOf function to the script- fixed InRange function
FMX.FastScript---------------[Engine]- fixed FastScript ClearLocalVars for an array of variants
[RTTI]+ added WeekOf function to the script- fixed InRange function- fixed fvtInt 64 support
Lazarus.FastScript---------------[Engine]- fixed FastScript ClearLocalVars for an array of variants
[RTTI]+ added WeekOf function to the script-fixed InRange function -fixed fvtInt 64 support
VCL.FastCube---------------[Engine]- fixed a bug when working with ftBCD fields
[UI]+ added icon for TfcxpMemoView+ added AutoExpandPopups property to TfcxSliceGridToolbar, like in TfcxSliceGrid- fixed the non-working context menu item "Create a custom filter..." for measurements
FMX.FastCube---------------[Engine]- fixed icon rendering
[UI]+ added icon for TfcxpMemoView+ added AutoExpandPopups property to TfcxSliceGridToolbar, like in TfcxSliceGrid- fixed the non-working context menu item "Create a custom filter..." for measurements- fixed CrossView editor- fixed ChartView editor
Lazarus.FastCube---------------[Exports]- fixed style font sizes when exporting for Lazarus and HiDPI
[UI]+ added icon for TfcxpMemoView+ added AutoExpandPopups property to TfcxSliceGridToolbar, like in TfcxSliceGrid- fixed the non-working context menu item "Create a custom filter..." for measurements
VCL.FastQueryBuilder---------------[Engine]+ added support for SQL escaping for table and field names+ added the TfqbFDEngine.TablePattern property
Lazarus.FastQueryBuilder---------------[Engine]+ added support for SQL escaping for table and field names+ added the TfqbFDEngine.TablePattern property
VCL.FastReport---------------[Client-server]- fixed a format detection error in Server Online-Designer API
[Engine]+ added a validator rule for checking script compilation+ added object validation rules+ added validation of report datasets+ added new property TfrxDataBand.BandColumns.Layout to control the order of printing columns (AcrossThenDown or DownThenAcross)+ added a new alignment type for objects—baHVCenter, which aligns the object by the width and height of the parent container.+ added report validator+ added image post-processing pipeline (mirroring and rotating images)* network printer settings use cached results to quickly load the report designer* accelerated rotations and reflections in PictureView - fixed rendering of translucent watermarks with Rotation less than 0- fixed the behavior of the transparency property for vector images- fixed the use of watermarks from the script- fixed a bug that caused the dynamic table to use previous values when working with repeating data bands- fixed decoding of Base 64 strings- fixed Richview break bug- fixed KeepTogether behavior when using the StartNewPage flag- fixed the behavior of the PrintOn property when the band moves to the next page- fixed a bug in GridTableBuilder when using default property editors
[Report object]+ added Transparency field to the TfrxPictureView object- fixed a bug in HTMLView that occurred when the table did not contain any columns- fixed a bug where 2D barcode presets were missing when exporting to PDF- fixed rotation of vector images at angles close to 45, 135, 225, 315 degrees- fixed support for the Win 64 platform
[Preview]- fixed a bug where the preview would trigger mouse click events while scrolling the page using the Pan tool
[Exports]+ added internal DataLink processing for HTML exports+ added read confirmation for mail export (Indy)- fixed PDF export dialog- fixed missing HTML tag styles in the DOCX export filter- fixed a bug when exporting an HTMLDiv embedded in another HTML page- fixed export to RTF of reports with pages of different orientations- fixed PDF export errors- fixed PDF export for 64-bit systems- fixed PDF structure with ZUGFERD- fixed export of Arabic to PDF- fixed issue with PNG/SVG transparency when exporting to PDF- fixed Embedded Subset in PDF- fixed export of spaces to PDF for lines with tab characters ($09)- fixed export of empty TfrxMemoView with AllowHTMLTags = True to DOCX- fixed errors in PDF/A and PDF with CMYK color space
[Designer]+ added intersection checking for bends+ added saving of DataTree settings in object and expression editors+ added DebugLn function to the report designer* improved search and highlighting of intersections* the default value for the TfrxDesigner.DefaultFont.Color field has been changed to clBlack- fixed the "Access Denied" error with the clipboard in the designer.- fixed usage of frxEditSQL.inc- fixed updating of internal parameters of data sets in edit mode- fixed a bug where the report designer inserted an incorrect mouse event for dialog controls- fixed adding icons for custom components- fixed opening of the run-time designer with a custom TfrxReport.IniFile- fixed highlighting of intersecting objects
FMX.FastReport---------------[Engine]+ added the ability to print reports with the enabled Skia Canvas function on Windows platform in RAD Studio 13
[Designer]- fixed tooltips in the designer- fixed a memory leak in the designer if there was an image in the clipboard- fixed sorting of the designer elements panel
[Exports]- fixed RTF export of reports with pages of different orientations- fixed incorrect size of 2D barcode during code export
Lazarus.FastReport---------------[Client-server]- fixed a format detection error in Server Online-Designer API
[Engine]+ added a validator rule for checking script compilation+ added object validation rules+ added validation of report datasets+ implemented the first version of the report validator + added new property TfrxDataBand.BandColumns.Layout to control the order of printing columns (AcrossThenDown or DownThenAcross)+ added a new alignment type for objects—baHVCenter, which aligns the object by the width and height of the parent container.+ added image post-processing pipeline* network printer settings use cached results to quickly load the report designer- fixed the use of watermarks from the script- fixed a bug that caused the dynamic table to use previous values when working with repeating data bands- fixed KeepTogether behavior when using the StartNewPage flag- fixed the behavior of the PrintOn property when the band moves to the next page- fixed a bug in GridTableBuilder when using default property editors
[Report object]+ added Transparency field to the TfrxPictureView object - fixed a bug in HTMLView that occurred when the table did not contain any columns- fixed a bug where 2D barcode presets were missing when exporting to PDF- fixed decoding of Base 64 strings- fixed rotation of vector images at angles close to 45, 135, 225, 315 degrees
[Preview]- fixed a bug where the preview would trigger mouse click events while scrolling the page using the Pan tool
[Exports]+ added internal DataLink processing for HTML exports- fixed PDF export dialog- fixed missing HTML tag styles in the DOCX export filter- fixed a bug when exporting an HTMLDiv embedded in another HTML page- fixed RTF export of reports with pages of different orientations- fixed PDF export dialog- fixed PDF export errors- fixed PDF export for 64-bit systems- fixed PDF structure with ZUGFERD- fixed export of Arabic to PDF- fixed an issue with PNG/SVG transparency when exporting to PDF- fixed Embedded Subset in PDF- fixed export of spaces to PDF for lines with tab characters ($09)- fixed export of empty TfrxMemoView with AllowHTMLTags = True to DOCX- fixed errors in PDF/A and PDF with CMYK color space
[Designer]+ added intersection checking for bends+ added saving of DataTree settings in object and expression editors+ added DebugLn function to the report designer* improved search and highlighting of intersections* the default value for the TfrxDesigner.DefaultFont.Color field has been changed to clBlack- fixed copying in the PictureView editor when there is no image- fixed usage of frxEditSQL.inc- fixed updating of internal parameters of data sets in edit mode- fixed a bug where the report designer inserted an incorrect mouse event for dialog controls- fixed adding icons for custom components- fixed opening of the run-time designer with a custom TfrxReport.IniFile- fixed highlighting of intersecting objects
VCL.FastGrid---------------[UI]+ added a new column deletion cursor+ added the ability to resize a column if its right border is out of view+ added cancellation of dragging and resizing columns by pressing ESC in design time- fixed highlighting of grid elements when dragging and resizing a column- fixed the cell frame being displayed on the header when scrolling the grid while in focus- fixed an issue on Linux where editing would not work if the editor was activated by clicking the mouse- fixed support for the Win 64 platform
[Engine]+ added the ability to group data in a table view+ added the TfrSpinEdit property. ValueType, MinValue, and MaxValue depend on the corresponding properties of the field bound to the SpinEdit column.- fixed a bug where the maximum length of text entered in a cell did not match the dimensions of the data field associated with the column of that cell.- fixed the OnKeyPress event to work with the WideChar type and fixed problems with navigation in Lazarus cells with UTF-8 characters- fixed an AV that would close the application if the built-in editor was active before setting Grid.Parent to nil.- fixed a bug where multiple exceptions were triggered when a column assigned with Image properties contained invalid data
[Exports]+ added the ability to create grouped tabular reports from FastGrid- improvements in the FastGrid table report builder
Lazarus.FastGrid---------------[UI]+ added a new column deletion cursor+ added the ability to resize a column if its right border is out of view+ added cancellation of dragging and resizing columns by pressing ESC in design time- fixed highlighting of grid elements when dragging and resizing a column- fixed the cell frame being displayed on the header when scrolling the grid while in focus
[Engine]+ added the ability to group data in a table view+ added the TfrSpinEdit property. ValueType, MinValue, and MaxValue depend on the corresponding properties of the field bound to the SpinEdit column.- fixed a bug where the maximum length of text entered in a cell did not match the dimensions of the data field associated with the column of that cell.- fixed the OnKeyPress event to work with the WideChar type and fixed problems with navigation in Lazarus cells with UTF-8 characters- fixed an issue on Linux where editing would not work if the editor was activated by clicking the mouse- fixed an AV that would close the application if the built-in editor was active before setting Grid.Parent to nil.- fixed a bug where multiple exceptions were triggered when a column assigned with Image properties contained invalid data
[Exports]+ added the ability to create grouped tabular reports from FastGrid- improvements in the FastGrid table report builder
VCL.Transport---------------[Engine]+ added read confirmation for mail transport (Indy)
VCL.FastEditors---------------[UI]+ added the OnButtonCustomDraw event to TfrButtonEditProperties+ added the BorderSpacing property for all Lazarus editors + added the ability to get the changed value of the editor using the Text property in Lazarus- fixed an error that occurred when trying to iterate through a drop-down list of values when the list is empty- fixed incorrect background display in TfrCalendar- fixed Access Violation error when TfrCalendar was destroyed or hidden during animation- fixed support for the Win 64 platform
[Engine]+ added new component TfrCalendar+ added new component TfrCurrencyEdit+ added new component TfrBarCode+ added new component TfrMaskEdit
Lazarus.FastEditors---------------[UI]+ added the OnButtonCustomDraw event to TfrButtonEditProperties+ added the BorderSpacing property for all Lazarus editors + added the ability to get the changed value of the editor using the Text property in Lazarus- fixed an error that occurred when trying to iterate through a drop-down list of values when the list is empty- fixed incorrect background display in TfrCalendar- fixed the Access Violation error when TfrCalendar was destroyed or hidden during animation- fixed support for the Win 64 platform
[Engine]+ added new component TfrCalendar+ added new component TfrCurrencyEdit+ added new component TfrBarCode+ added new component TfrMaskEdit
.png)
April 09, 2026
Version 2026.2 for FastReport .NET is Now Available
Version 2026.2 of FastReport .NET adds .NET 10 support for all libraries. Key features include customization of the form (9 options) and the rotation angle of QR code modules, drag-and-drop band movement in the designer, a plugin for connecting to Google Sheets, an option to embed fonts when exporting to MS Word, and improved export to PDF (with ZUGFeRD support) and MS Excel. The WebReport architecture has also been optimized.
New Features
.NET 10 support
We have added .NET 10 support for FastReport .NET, FastReport.Core, FastReport.Core.Skia, FastReport.WPF, FastReport.Avalonia, as well as FastReport.Web, FastReport.Web.Skia, and FastReport.Blazor.Wasm. This platform improves application performance and adds many new features to your projects.
You can read about the changes in our article at this link.
Read the article
Changing the shape of QR code modules
A QR code consists of dots called modules. By default, they are rectangle. Starting with version 2026.2, module shapes can be changed and customized. In addition to the rectangle, nine new module shapes are now available: circle, diamond, rounded square, horizontal pill, vertical pill, plus, hexagon, star, and snowflake.
Beyond module shape, you can now specify their rotation angle (the Angle property). You can also make the QR code less dense by making each module smaller using the UseThinModules property. This latter property does not affect the Finder patterns (the large squares in the corners of the QR code), as they help scanners determine the code's boundaries and dimensions.
A standard QR code looks like this:
And this is the code with modules in the shape of a circle:
Although new modules allow for more diverse and interesting codes, it's important to remember that not all scanners can read these QR codes equally well.
Read more about the new properties and their use in our article.
Read the article
Moving bands in the designer
Our reports can have multiple band types, each with a different purpose. For example, the report title is always at the top of the report. Another example is the page footer, which is located at the bottom of every page. The relative positions of these bands cannot be changed.
However, there are types of bands that can have multiple instances, and their relative positioning may change. For example, a report might have three data bands.
Previously, their position could only be changed in a special band settings window:
Now you can move bands directly in the designer by simply dragging them:
You can find more details about the features and limitations of this new movement mechanism in the article.
Read the article
Connecting to Google Sheets
This update introduces a new plugin that lets you use Google Sheets data as a report data source. Google Sheets is a cloud-based spreadsheet application. This plugin allows you to directly connect reports to these spreadsheets, providing convenient access to the data you need.
Google Sheets (like any spreadsheet software, in fact) maps perfectly onto our report-building concept. However, it's a web application and has a number of unique features that distinguish it from desktop solutions.
Read our article to learn how to connect this new plugin.
Read the article
Export Improvements
Embedding fonts when exporting to Microsoft Word
Our Microsoft Word export now includes a new "Embedded Fonts" option:
This option allows you to enable or disable font embedding when saving a completed report as a DOCX file. This option will save all fonts used in the report in the final file.
This ensures that the document will look the same on any computer, even if the required fonts are missing. However, keep in mind that the file size when using this option will be larger than with a standard export.
Enhanced ZUGFeRD support when exporting to PDF
ZUGFeRD-enabled PDF export has been significantly redesigned and improved. Files now comply with the latest version of ZUGFeRD and pass validation successfully. Numerous errors related to exporting these files have been fixed.
Global improvements to Microsoft Word and Microsoft Excel exports
The code for exporting to DOCX and XLSX document formats has been optimized and improved. Exports now run faster and can be opened by most applications, not only Microsoft Office but also third-party office suites.
Changes in WebReport
Improved architecture of the WebReport client side
As part of the WebReport improvements, the client side was refactored:
CSS and JavaScript have been moved to static files, eliminating inline scripting entirely. WebReport now doesn't require inline scripting to be enabled in the Content Security Policy (CSP), improving product security.
Report IDs have been removed from CSS class names, making WebReport more flexible and easier to customize.
The scripts are collected into bundles, which significantly speeds up page loading.
Full list of changes
[Engine]+ added new mode for TextObject.AutoShrink property - FitText;+ added additional properties required for third party JSON type connections;+ added linear barcode properties - OneBarWidth, FitDevicePixels;+ added the ToWords function for Chinese;- fixed error with dialog controls data filtering;- fixed a bug that prevented temporary files from being deleted when using UseFileCache;- fixed duplicate datasource name when creating JSON connection;- fixed a bug with importing DOCX documents;
[Designer]+ added the ability to change the shape of QR-code modules;+ added the ability to move bands in the designer;* the error message is now more informative when the names in the SQL-query are incorrect;* the Relation Editor window can now be resized;- fixed a bug with visibility of StartReport and FinishReport events;- fixed a bug when adding the Report component on a form;- fixed a bug when switching to FRX page in the designer;- fixed a bug in the DataSource property editor;- fixed a bug in Messages window of Designer for platforms .NET 6.0 and higher;- fixed text overlapping in the query builder;- fixed a field naming error in the query builder for Postgres;- fixed legend colors for auto-series in MSChart;- fixed incorrect drag-n-drop behavior in the Matrix object;
[Preview]+ added icons to the export menu for items that were previously missing them;
[Exports]+ added the ability to improve image quality when exporting to Word;+ improved PDF export with ZUGFeRD support. Files now comply with the latest version of ZUGFeRD and pass validation successfully;+ added the ability to export landscape-oriented pages to ZPL;+ improved compatibility of DOCX and XLSX exports with non-MS office software;+ improved export of images intersected with other objects to XLSX format;+ added the ability to embed fonts when exporting to MS Word;- fixed a problem with opening some files when exporting to Excel;- fixed a bug with width of margins in export to Word;- fixed the System.NullReferenceException when exporting to Word using Paragraphs and MatrixBased modes;- fixed a bug with default font size in XLSX-export;- fixed export of polygons to table-based formats;- fixed error in DOCX export with multiple headers/footers;- fixed issues with the color of some objects when opening DOCX documents in OpenOffice;- fixed a bug with missing images when WYSIWYG property of export is turned off;- fixed extra spaces in DOCX export when using HtmlTags rendering;- fixed a bug in PDF export where the file was created in the wrong folder;
[WebReport]+ added option CentredAndWrapPages in WebReport;- fixed height of WebReport for .NET Framework;
[Common]+ added a start/stop character property field to Codabar;- fix DragAndDrop in Avalonia and WPF;- fixed the JSON database binding scheme;
[Demos]+ updated icons of Demo Center;- fixed bugs with launching demo applications in Demo Center;
[Extras]+ added Apache Ignite plugin for Avalonia, Core, OpenSource and WPF platforms;+ added connection to Google Sheets;- fixed a bug when connectiong to JSON Database.
March 26, 2026
FastReport products support the latest version of RAD Studio — 13.1 Florence
Starting from version 2026.1.7, FastReport products for Delphi support the most up-to-date version of the development environment — RAD Studio 13.1. And in April, FastReport 2026.2 will be released with even more updates!
Why is support for RAD Studio 13.1 Florence important?
Developers have enhanced support for new platforms, improved stability, and increased IDE performance. But the key change is the introduction of Windows on ARM support in Delphi.
Delphi now includes a native ARM compiler (Arm64EC). Applications can run directly on ARM-based devices without Intel emulation. This makes them faster and more stable, without unnecessary layers. However, FastReport VCL doesn't support the Arm64EC platform.
At the same time, little to no code changes are required. The same projects can be compiled for Win32, Win64, and ARM. Essentially, this adds another platform while keeping the development process familiar.
As a result, this update doesn’t disrupt existing workflows — it extends them. You can simply take an existing project, rebuild it for the new architecture, and get a more modern and high-performance application.
You can purchase the latest version of FastReport for Delphi here.
.png)
March 23, 2026
The Latest FastReport Version: 50% Discount on Updates
From March 23 to April 6, 2026, a special offer is available for customers with expired FastReport licenses. During this period, you can purchase the latest versions of FastReport .NET and FastReport VCL report generators with a 50% discount.
The promotion applies to FastReport .NET editions: Ultimate, WEB, Avalonia, WPF, WinForms, Mono, as well as to FastReport VCL editions: Ultimate, Optimum, Reporting VCL, Reporting FMX, Reporting Lazarus, Analysis VCL.
The offer is valid for Single, Team, Business, and Site licenses and allows you to upgrade to the current product versions under special conditions, even if your license has expired a long time ago.
Updating provides access to the latest FastReport features, including new functionality, an updated report designer, technical support, and improved performance. Additional releases with new functionality are also planned in the coming months and will be available only to owners of active licenses.
After the promotion ends, the discounted price can still be locked in for an additional 7 days if necessary.
To take advantage of the offer or receive more information, please contact the sales team at sales@fast-report.com.