Analysis VCL verarbeitet Arrays sofort und wandelt Datenbankinformationen in kompakte und allgemeine Berichte um. Integrieren Sie die OLAP-Bibliothek in Ihr Projekt, bereiten Sie die Daten (oder mehrere Sätze) vor, die Ihre Benutzer für die Analyse benötigen, und integrieren Sie BI in Ihre Anwendung.

Kreuztabelle
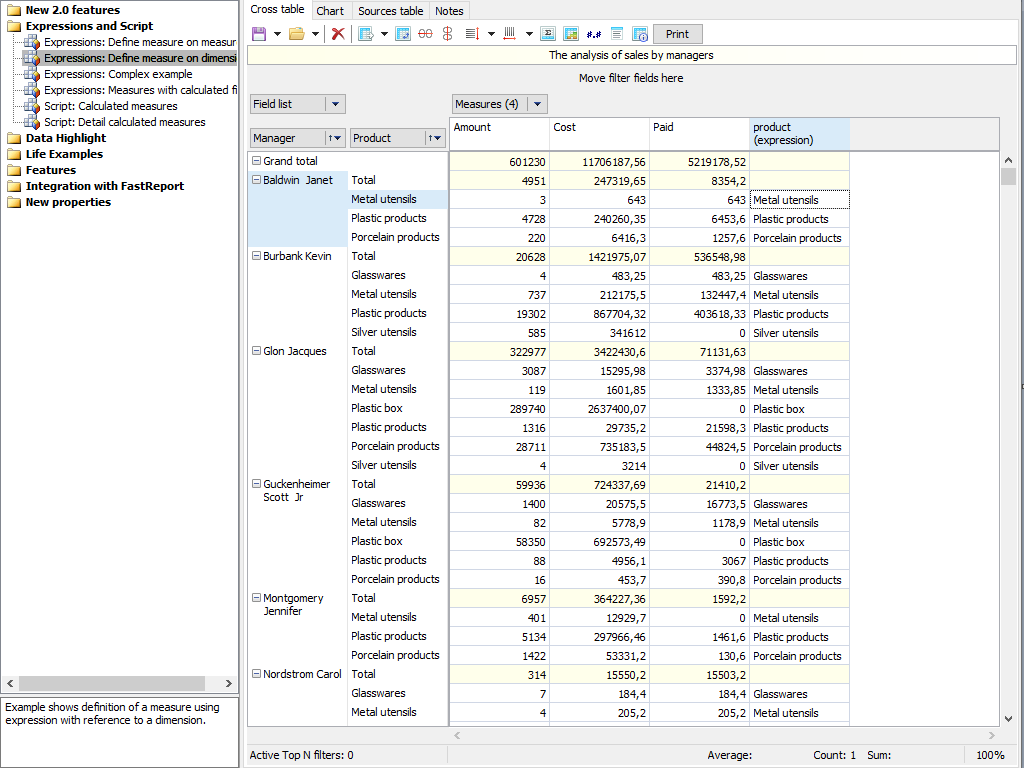
Die Analysis VCL besteht aus einer Kreuztabelle - einem interaktiven Werkzeug zur Datenpräsentation und —analyse. Im oberen und linken Teil der Tabelle befinden sich mehrstufige Kopfzeilen, die mit den Werten der Dimensionen gefüllt sind. Der mittlere Teil der Tabelle zeigt die Werte der Indikatoren an.
Die Kreuztabelle besteht aus vielen Bereichen: der Kopfzeile der Kreuztabelle, dem Bereich der Filterfelder, den vertikalen und horizontalen Kopfzeilen der Dimensionen, der vertikalen und horizontalen Kopfzeile der Kreuztabelle, dem Datenbereich, der Feldliste, der Liste der Top-N-Filter, dem Bereich der Aggregatberechnungen für die ausgewählten Zellen und der Skalierungssteuerung.

Sortierung
Die Daten in der Kreuztabelle werden in einer streng sortierten Reihenfolge angezeigt, unabhängig von ihrer ursprünglichen Reihenfolge in den Quelldaten. Die Sortierreihenfolge kann entweder aufsteigend oder absteigend sein. Für numerische und zeitbasierte Werte bedeutet die Reihenfolge ihre natürliche Reihenfolge der Abfolge. Für Zeichenfolgenwerte wird die alphabetische Reihenfolge der Reihenfolge angewendet.
Jede Dimension der Kreuztabelle kann ihre eigene Sortierreihenfolge von Werten haben. Standardmäßig wird eine aufsteigende Sortierung angewendet. Sie können die Sortierreihenfolge einer Dimension ändern, indem Sie auf die Dimensionsüberschrift doppelklicken oder eine Option im Kontextmenü auswählen.
Features und Vorzüge Analysis VCL

Bedingte Datenauswahl
In der Kreuztabelle können Sie den Anzeigestil für bestimmte Metrikwerte festlegen. Sie können Daten innerhalb eines bestimmten Bereichs oder außerhalb seiner Grenzen auswählen. Die Auswahlregel behandelt Werte, Text, Datumsangaben und NULL. Für die numerische Verarbeitung werden die Operationen "mehr" oder "weniger" verwendet, für die Textverarbeitung das Vorkommen oder Nichtvorkommen einer Teilzeichenfolge in einer Zeichenfolge.
Der Anzeigestil wird im Editor festgelegt. Hier können Sie die Hintergrundfüllung, die Farbe und den Textstil auswählen. Für die Verlaufsfüllung müssen Sie "Füllfarbe 1" und "Füllfarbe 2" einstellen. Zusätzlich zur bedingten Auswahl von Zellen können Sie eine von vier Auswahlarten auf alle Werte anwenden.

Datenpräsentation
Sie können beliebige Slices aus dem OLAP-Cube in die folgenden Formate exportieren: Excel und Word (XLS, XML, XML für die Analyse, XML-msdata, MS-Rowset, mit Embarcaderos ClientDataSet kompatibles Datenpaket) sowie HTML (Tabellen- und Excel-Arbeitsblatt-HTML).
Mit flexiblen Komponenteneinstellungen können Sie Funktionen auswählen, z. B.: Wiederholen von Achsenwerten für jede Zeile / Spalte, Auswählen der Ausgabedatei zum Anzeigen des Rasters und vieles mehr.

FastScript-Formeln
Analysis VCL verwendet FastScript, um nicht standardmäßige Berechnungen durchzuführen. Mithilfe von Skripten können Sie Indikatoren und Filter berechnen. Sie können die Datenverarbeitung nach oder gleichzeitig mit Standardindikatoren einstellen.
Für Indikatoren können Sie vom Skript festgelegte Filter festlegen. Dieser Filter wird verwendet, wenn Indikatoren nicht für alle Zeilen des ursprünglichen Datensatzes, sondern nur für ausgewählte Zeilen berechnet werden müssen. Der Berechnungsfilter kann sowohl auf Kennzahlen angewendet werden, die auf Standardaggregatfunktionen basieren, als auch auf berechneten Kennzahlen.
Ultimate VCL
Dieser Komponentensatz ist Teil der ultimativen Lösung, mit der Sie Ihre Geschäftsprojekte auf allen bekannten VCL-, Lazarus- und FMX-Plattformen erstellen können. Darüber hinaus enthält das Paket FastScript für die schnelle Verarbeitung von Skripten beliebiger Komplexität sowie den visuellen SQL-Abfrage-Builder FastQueryBuilder. Darüber hinaus haben Sie Zugriff auf Client-Server-Reporting-Tools auf VCL und Lazarus.
Lieferoptionen
| Features |
ab 1.299 €
|
ab 899 €
|
ab 399 €
|
|---|---|---|---|
| FastReport Engine |
|
|
|
| VCL-Komponenten |
|
|
|
| FMX Komponenten |
|
|
|
| Lazarus Komponenten |
|
|
|
| OLAP-Funktionen |
|
|
|
| OLAP-Aggregationsfunktionen |
|
|
|
| Datenverbindungen |
|
|
|
| Berichterstellungsfunktionen |
|
|
|
| Berichtsobjekte |
|
|
|
| Barcodes |
|
|
|
| Diagrammtypen |
|
|
|
| Druckfunktionen |
|
|
|
| Exportformate |
|
|
|
| Kundendienst |
|
|
|
| Quellcode |
|
|
|
| Konverter von |
|
|
|
| Datenübertragungswege (Transports) |
|
|
|