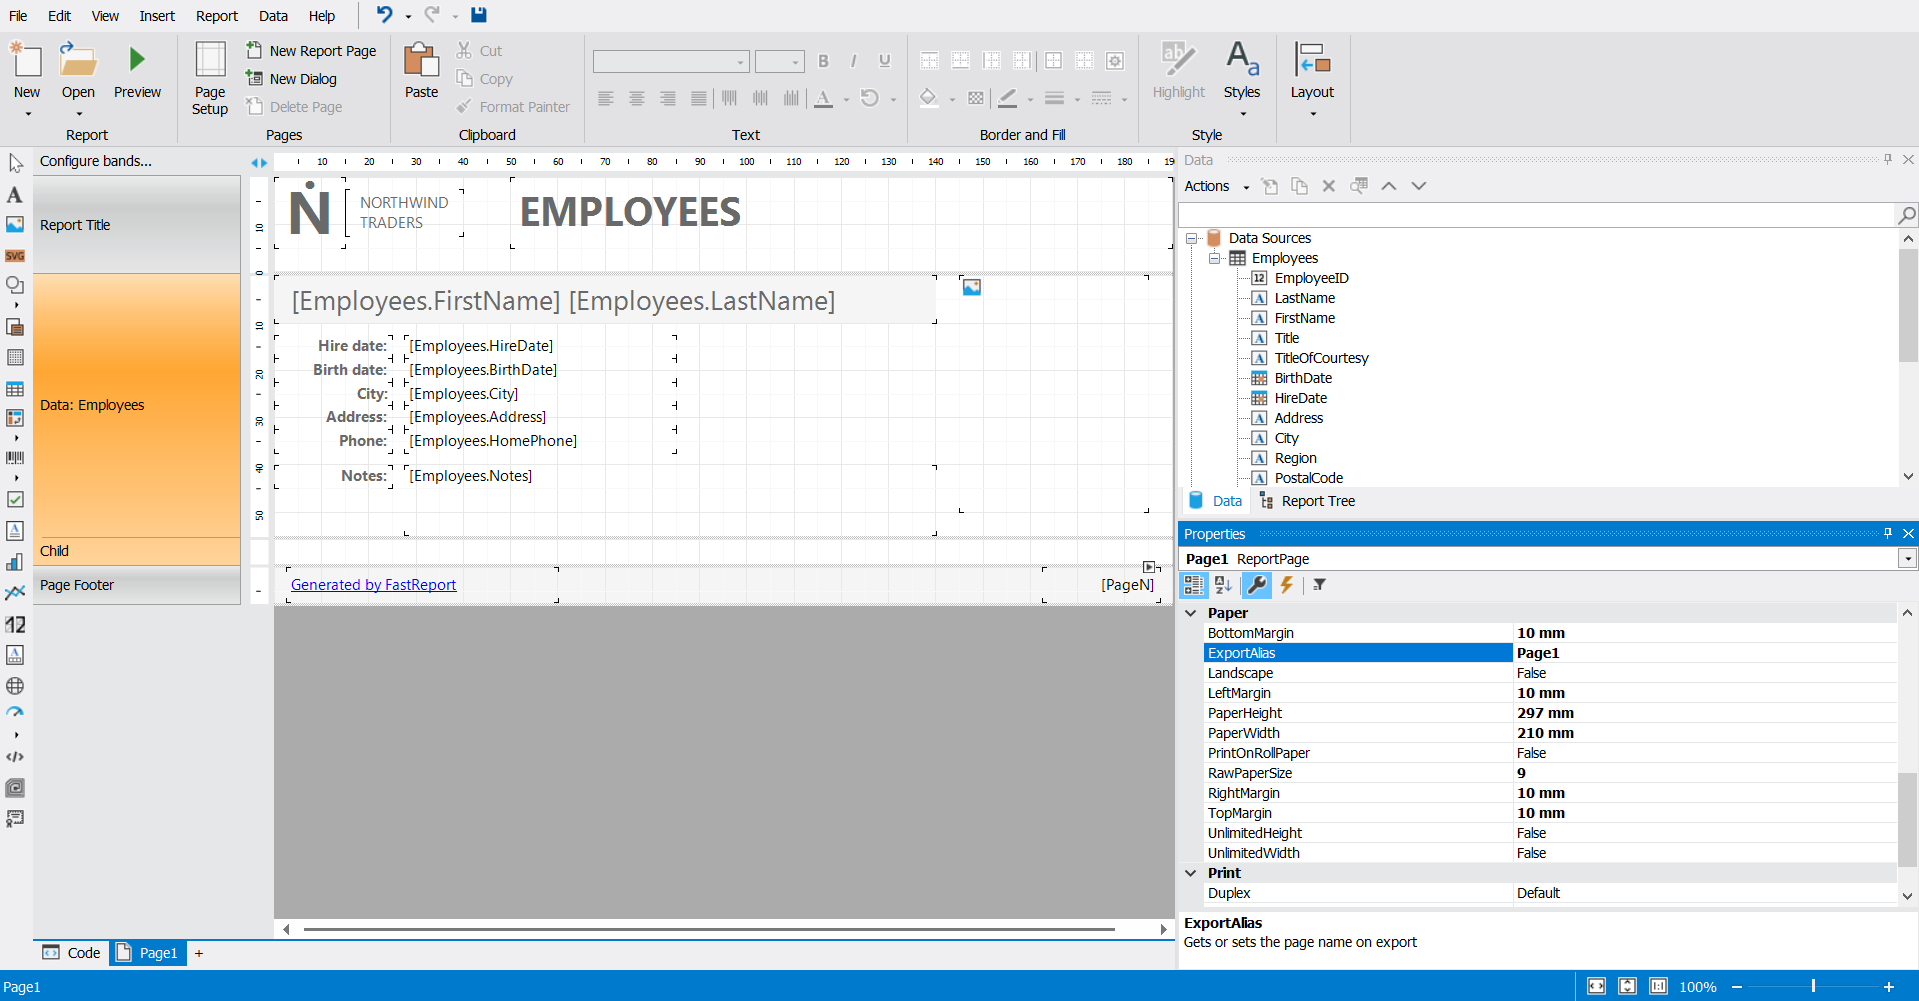
Welche Berichte kann FastReport .NET WinForms erstellen?
Praktisch alle: Rechnungen, Finanzberichte, Produktkataloge mit Farbprofilunterstützung, Restaurantmenüs, Verkaufsdetails, Fragebögen mit elektronischen Formularen, Flugtickets, Stromrechnungen und vieles mehr. Wenn Sie Daten haben, die visuell verständlich gemacht werden müssen, ist FastReport die perfekte Lösung für Sie.
Features und Vorzüge WinForms
Vorlagendesigner
Der eigenständige Desktop-Berichtsdesigner ist das Herzstück von FastReport. Es ermöglicht sowohl Entwicklern als auch Benutzern, benutzerdefinierte Berichte ohne großen Aufwand zu erstellen, zu bearbeiten, anzuzeigen, zu speichern, zu exportieren und zu drucken. Der Designer kann zur Laufzeit (run-time) verwendet werden. Auf diese Weise können Ihre Benutzer vorhandene Dokumente eigenständig bearbeiten und neue erstellen. Der Designer kann auch im MDI-Modus (Multi Document Interface) verwendet werden, um mit mehreren Berichten gleichzeitig zu arbeiten.
Die Lokalisierung wird für mehr als 25 beliebte Sprachen der Welt unterstützt.
FastReport .NET WinForms ist ein bandorientierter Berichtsgenerator. Mit einer Vielzahl von Bändern können Sie Berichte aller Art erstellen: Liste, Master-Detail, Bericht mit Gruppierung, mehrspaltig, Master-Detail-Detail und andere. Wenn Sie viele Berichte erstellen müssen, die dieselben Elemente enthalten (Kopfzeile, Fußzeile, Firmendaten, Logos), können Sie gemeinsame Elemente in einem Basisbericht sammeln und alle anderen Berichte davon erben. Wir unterstützen auch Unterberichte.

Datenverarbeitung
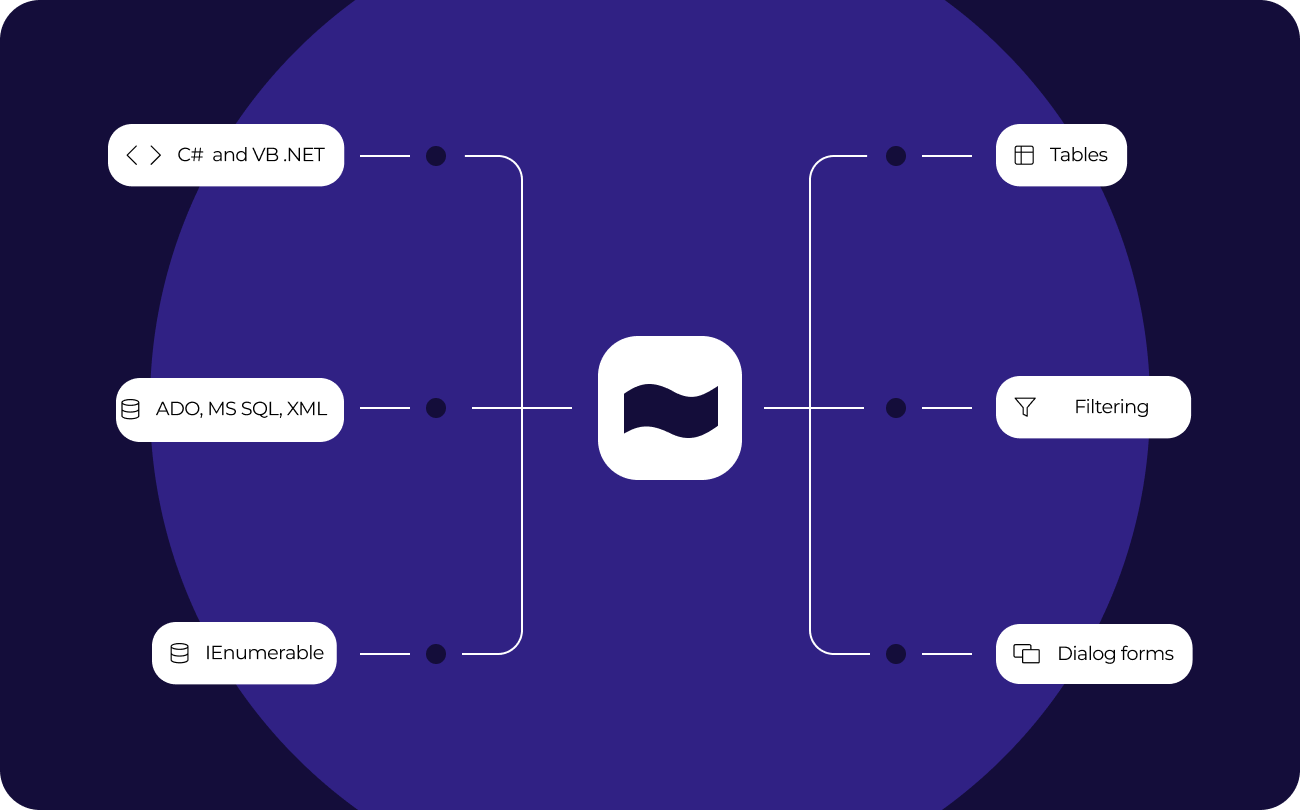
FastReport .NET WinForms arbeitet mit ADO .NET-Datenquellen. Es unterstützt das Sortieren und Filtern von Daten sowie Master-Detail-Beziehungen. Alles kann mit wenigen Klicks konfiguriert werden. Es ist möglich, eine Verbindung zu ADO-, MS SQL- und XML-Datenbanken herzustellen. Konnektoren sind für die Verbindung mit anderen Datenbanktypen verfügbar, und Sie können auch Daten von Geschäftsobjekten des Typs IEnumerable abrufen.
Ihr Bericht kann Daten (Tabellen, Abfragen, Datenbankverbindungen) enthalten. Auf diese Weise können Sie nicht nur die in Ihrer Anwendung verfügbaren Daten verwenden, sondern auch unabhängig direkt aus dem Bericht eine Verbindung zu einer beliebigen Datenbank herstellen. FastReport .NET WinForms enthält eine Skript-Engine, die C # und VB .NET unterstützt. Sie können die Leistungsfähigkeit von .NET in Ihrem Bericht für komplexe Datenverarbeitung, Dialogformularverwaltung und mehr nutzen.
Der Bericht kann Dialogformulare enthalten, um Parameter anzufordern, bevor der Bericht erstellt wird. Dialogsteuerelemente unterstützen die Möglichkeit, eine Verbindung zu Daten herzustellen und diese dann zu filtern. Die Filterung kann zu absolut jedem Bericht hinzugefügt werden, es muss kein Code geschrieben werden. Mit dem visuellen Abfrage-Generator müssen Sie SQL nicht kennen, um eine komplexe Abfrage aus mehreren Tabellen zu erstellen.
Vorschau und Drucken
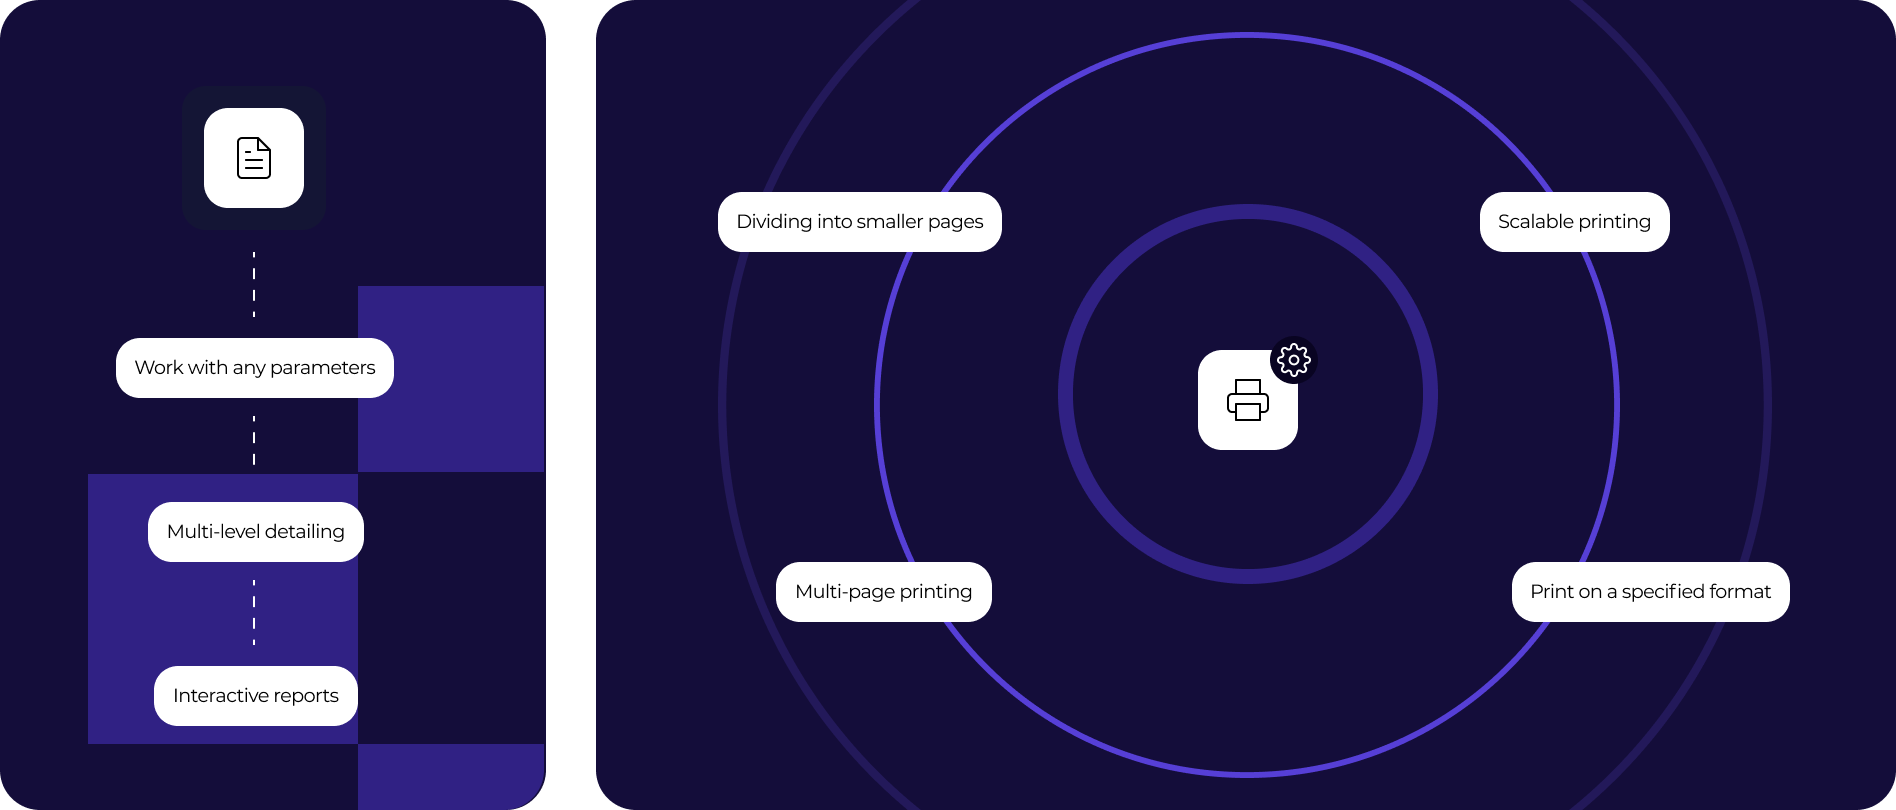
Der vorbereitete Bericht kann im Vorschaufenster des Berichtsviewers detailliert untersucht werden. Unsere Komponente unterstützt das Arbeiten mit Parametern, mehrstufigen Details und interaktiven Berichten. Im Vorschaufenster können Sie eine Reaktion auf einen Mausklick auf ein Objekt definieren. Sie können beispielsweise einen weiteren Bericht erstellen und anzeigen, der detaillierte Informationen zu dem Objekt anzeigt, auf das der Benutzer geklickt hat.
Zusätzliche Druckeinstellungen. Folgende Optionen stehen Ihnen zur Verfügung: Schneiden großer Berichtsseiten in kleine, Drucken mehrerer kleiner Seiten auf eine große und Drucken in einem bestimmten Format mit Skalierung. Müssen Sie einen Bericht mit A3-Seiten auf einem normalen A4-Drucker drucken? Nun, das ist kein Problem!
Exportiert in praktische Formate
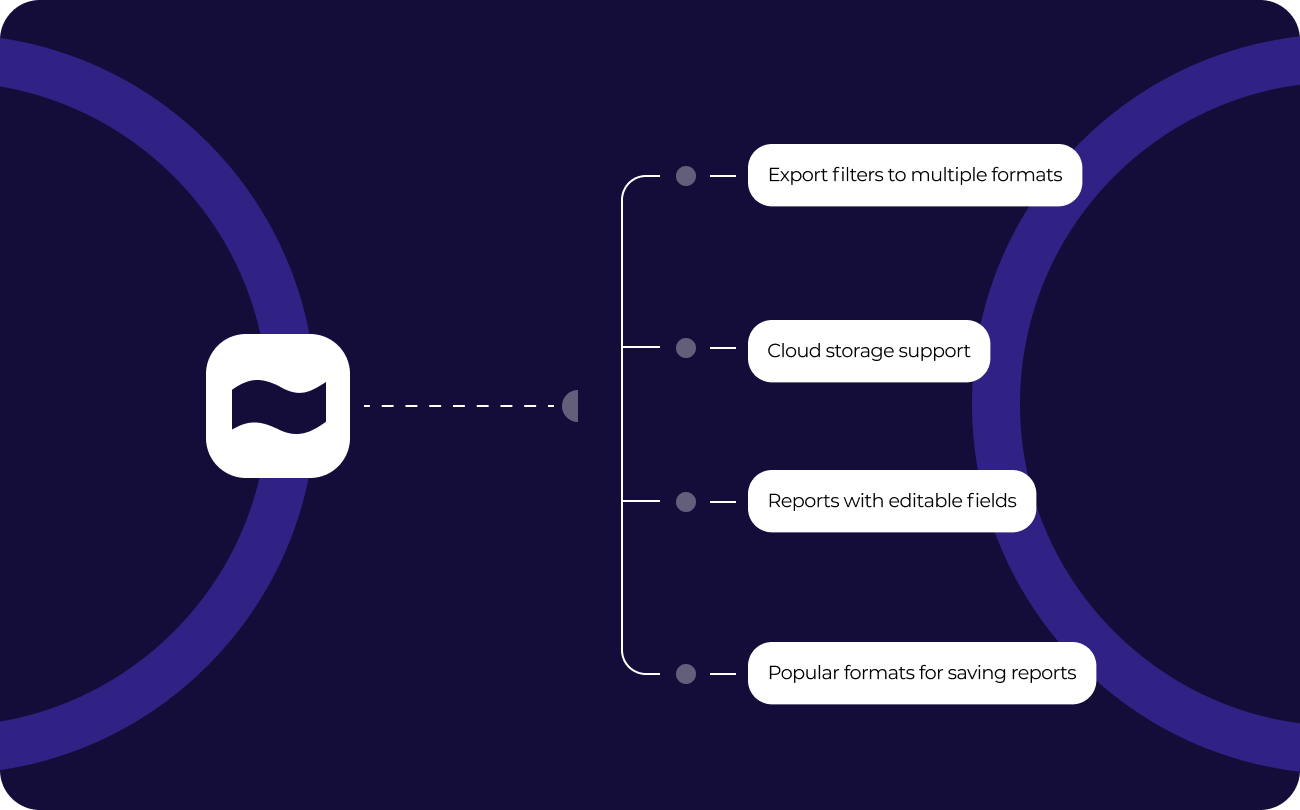
Filter zum Exportieren des fertigen Berichts in viele Formate: PDF, RTF, XLSX, XML, DOCX, TXT, CSV, PowerPoint, HTML, MHT, XPS, JPEG, BMP, PNG, Open Document Format (ODT, ODS, ODP), XAML, Skalierbare Vektorgrafiken (SVG), DBF, PPML usw. Cloud-Unterstützung: Microsoft Onedrive, Google Drive, Box, Dropbox, FastReport Wolke.
Mit FastReport .NET WinForms können Sie Berichte mit bearbeitbaren Feldern (z. B. Textfelder, Kombinationsfelder, Kontrollkästchen, Optionsfelder und Grafikfelder) schnell in PDF-Dokumente konvertieren, ohne zusätzliche Bibliotheken anzuschließen. Speichern Sie Ihre Berichte in gängigen Formaten: PDF 1.5, PDF / A-1a, PDF / A-2a, PDF / A-2b, PDF / A-2u, PDF / A-3a, PDF / A-3b, PDF / X-3 und PDF / X-4, die sicher, zugänglich und zuverlässig sind.
Ultimate .NET
Dieser Komponentensatz ist Teil der ultimativen Lösung, mit der Sie Ihre Geschäftsprojekte auf allen modernen .NET, ASP.NET , Blazor, WASM, WPF, WinForms, Avalonia UI, Mono und andere Plattformen. Mit Ihrem Team können Sie sowohl im Desktop Designer als auch direkt aus dem Browser arbeiten. Das Ultimate-Paket enthält auch Komponenten für die Datenvisualisierung, nämlich Geschäftsgrafiken mit einer Reihe von Diagrammen und OLAP-Produkten für die schnelle Verarbeitung großer Datensätze.
Lieferoptionen
| Features |
ab 1.499 €
|
ab 799 €
|
ab 499 €
|
|---|---|---|---|
| FastReport Engine |
|
|
|
| Web-Komponenten |
|
|
|
| WinForms-Komponenten |
|
|
|
| Avalonia-Komponenten |
|
|
|
| WPF-Komponenten |
|
|
|
| Mono-Komponenten |
|
|
|
| Online Designer |
|
|
|
| FastReport.Drawing (Skia) |
|
|
|
| System.Drawing (GDI) |
|
|
|
| Berichtsskriptengine |
|
|
|
| Datenverbindungen |
|
|
|
| Berichterstellungsfunktionen |
|
|
|
| Berichtsobjekte |
|
|
|
| Barcodes |
|
|
|
| Diagrammtypen |
|
|
|
| Druckfunktionen |
|
|
|
| Exportformate |
|
|
|
| Datenübertragungswege (Transports) |
|
|
|
| Konverter von |
|
|
|
| Plugins |
|
|
|
| Unterstützung für benutzerdefinierte Plugins |
|
|
|
| Quellcode |
|
|
|
