Vector graphics in FastReport.Net 2019.4
Back in FastReport.Net 2018, entry-level vector graphics appeared in the reports. These were polygons and curves. It was possible to build complex shapes, but all the curves were straight. In version 2019, Bezier curves finally appeared - and therefore, full-fledged vector graphics. Now we can create any shapes. Let's look at updates in detail.
First of all, you will notice a difference from the previous versions on the top property bar. On the Home tab there is a section Polygon.

Previously, we had access to a set of actions with a polygon / polyline, which appeared above the figure when it was selected:
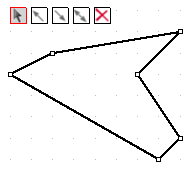
These controls allowed to move points, add a line to the beginning, add a line to the end and add points.
With the appearence of Bezier curves, we had to rework the concept of editing a vector object. Each point on the curve now has vectors defining the curvature. If it is a broken line, not a figure, then the extreme points have one vector, all others have two vectors, in order to adjust the curvature before and after the point.
But back to the new Polygons toolbar. Consider its elements:
![]() - moving the figure;
- moving the figure;
![]() - figure editing;
- figure editing;
![]() - adding points;
- adding points;
![]() - editing the curvature vectors, initialization of points;
- editing the curvature vectors, initialization of points;
![]() - deleting points.
- deleting points.
Consider how to use these controls in the examples of creating a polyline ![]() and polygon
and polygon ![]() .
.
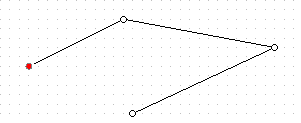
A polyline is initially defined by points that do not have curvature vectors:
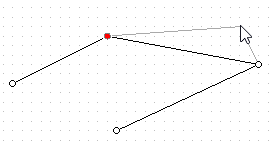
If earlier you could add lines only to the beginning or end, now it is enough to choose in edit mode ![]() the desired point on the curve, then go to the mode of adding points
the desired point on the curve, then go to the mode of adding points ![]() and you will immediately be offered the option of adding a point and lines connecting it with the selected point and the next point closest to the mouse cursor:
and you will immediately be offered the option of adding a point and lines connecting it with the selected point and the next point closest to the mouse cursor:
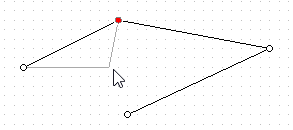
If you want to make a broken Bezier curve, then you need to go to the mode ![]() . While in this mode, you can initialize the Bezier curve by selecting a point on the polyline and changing the direction of the curvature vector for it:
. While in this mode, you can initialize the Bezier curve by selecting a point on the polyline and changing the direction of the curvature vector for it:
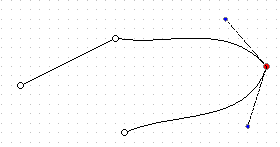
To change the curvature of a segment drawn to a selected point, move the mouse cursor over the blue point of the vector outgoing from the selected point towards the previous point. You can change not only the angle of the vector, but also its length, it will also affect the curvature of the segment. The curvature for the segment drawn from the selected point is set in the same way.
After that, in any shape editing mode, the modified point will be displayed with curvature vectors. If you want to get rid of the Bezier curve in your broken line, you will have to delete this point in delete mode ![]() , and then re-add it
, and then re-add it ![]() .
.
To delete a point, go to the mode ![]() and just select the point to be deleted with the mouse cursor. In this case, the segments that are suitable for this point will also be deleted, and the neighboring ones from the remote point will be connected by a new segment.
and just select the point to be deleted with the mouse cursor. In this case, the segments that are suitable for this point will also be deleted, and the neighboring ones from the remote point will be connected by a new segment.
In the situation with the polygon, everything is exactly the same. That is, initially all points on the figure do not have the segment curvature settings.
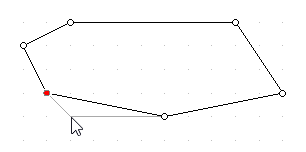
To create a polygon with Bezier curves, select the mode ![]() and alternately select points on the figure, changing the position of the curvature vectors of the segments.
and alternately select points on the figure, changing the position of the curvature vectors of the segments.
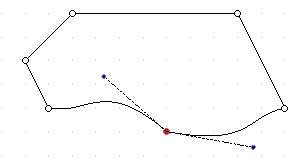
If you change the position of the curvature settings for a point, from now on these settings will be available in any editing mode. That is, to return the segment to the original straight line mode, you will have to delete the point and add it again.
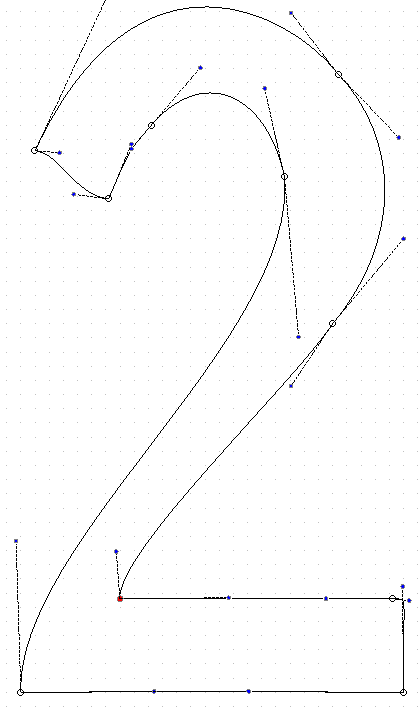
It is worth noting that drawing curves without proper practice can take quite a long time. Even creating such a simple figure:
Therefore, in the next article we will look at the way to create vector objects in a report from application code, or a report script.