Using FastCube for multidimensional data analysis
On-the-fly data aggregation of "flat" database tables is one of the first tasks faced by information system developers and their users. At the same time it is usually difficult to foresee the user needs in terms of data selection criteria (filters), dimensions in which the data needs to be aggregated (slices) and a list of aggregated fields (measures). The need of developing new SQL-queries and reports for each user request sometimes consumes time which could be better spent on information systems development.
Thus the question arises how to give user an ability to create pivot reports without the help of a programmer? In the FastReports product line this task is handled by the FastCube component set. By connecting a data source to the FastCube pivot table we are getting a tool which allows dimensions, filters and measures managing.
The next small example demonstrates how it is simple and quick to create applications which allow users to build pivot tables.
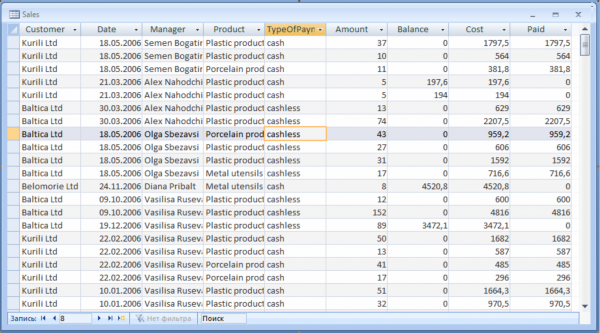
Let's take "salesdb.mdb" database with a "sales" table which contains products sales data of a wholesale company. The table contains the following fields:
- Customer - Customer
- Date - Sale date
- Manager - Responsible manager
- Product - Type of product
- Amount - The number of units
- Balance - The customer's balance
- Cost - The cost of sold good
- Paid - The amount of payment received for this sale
The table contains data about 3218 sales for 2006 year:
Let's start application development:
Create a new application and add a TPanel Panel1 to the main form. The panel will contain the needed buttons. Set the panel alignment to bottom edge (Panel1.Align := alBottom).
We will use ADO connection to access the database - these components are included by default in Delphi (dbGo component set). However, if you prefer, you can choose any other data access engine, as long as the components which work with tables and queries derive from standard Delphi TDataSet class.
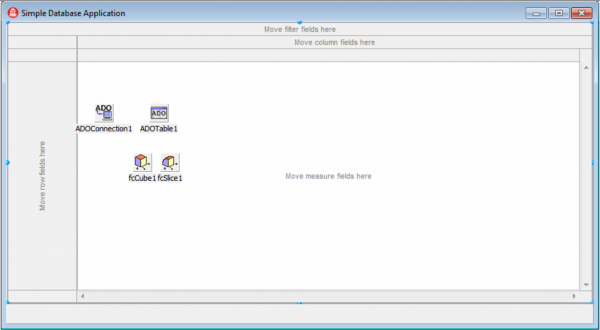
Add a database connection component (ADOConnection1: TADOConnection) and a table access component (ADOTable1: TADOTable) to the form and connect them the table "Sales" from the "Salesdb.mdb" database. Set ADOConnection1.LoginPrompt = False, to skip the database login dialog on connect.
Let's turn to the FastCube components now. First, we need three components:
fcCube1: TfcCube - this component is responsible for the data loading, arranging and storing it in the memory.
fcSlice1: TfcSlice - is responsible for filtering and storing the pivot table structure.
fcGrid1: TfcGrid - visualize a pivot table and allows a user to manage the structure and filters.
Add them to the form.
Connect fcCube1 to the data source: fcCube1.DataSet := ADOTable1.
Connect fcSlice1 with fcCube1: fcSlice1.Cube := fcCube1.
Connect fcGrid1 with fcSlice1: fcGrid1. Slice = fcSlice1.
Set fcGrid.Align = alClient.
Now we need to add one line of code which initiate the data loading and activate the pivot table in OnCreate event handler of the form:
Code
1 2 3 4 |
procedure Tfm_Article1.FormCreate (Sender: TObject); begin fcGrid1.Open; end; |
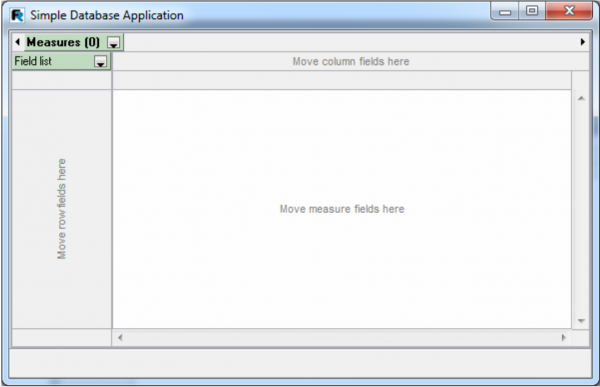
You can run the application and build a pivot table.
Once launched, we see an empty table, which must be customized to display our data in the required form. To do this we need to place fields in the rows, columns and filters and create measures.
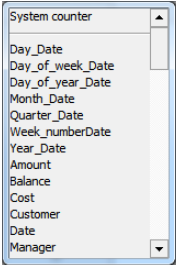
Open the drop-down list "Field List". We see the list of fields from the source table in it. Note that the list contains the fields "Day_Date", "Day_of_week_Date" and others which were not present in the "Sales" table. These fields are automatically created for the "Date" field and we can use them to build slices by date parts or for filtering.
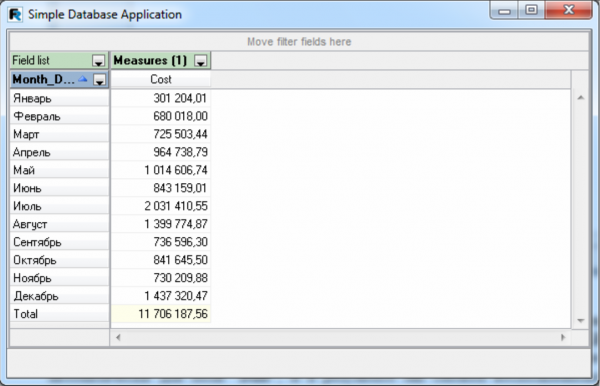
Suppose we want to find out the total sales for the month (remember that the source table has only data for 2006). To do this we need to drag the "Month_Date" to the row area, the field "Cost" to the data area and the service dimension "Measures" from the filters to the column area. In result we get the required data.
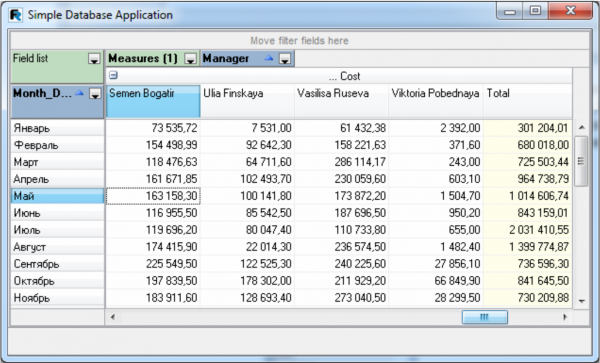
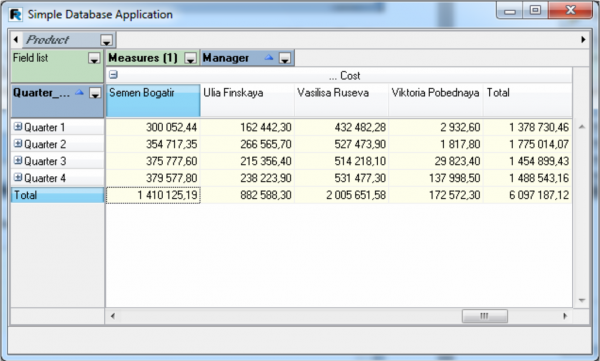
Let's complicate the task. Let we additionally interested in sales by month for each manager.For this purpose it is sufficient to drag the field "Manager" to the column area.Note that the field "Manager" can be placed after the field "Measures" as well as before it.
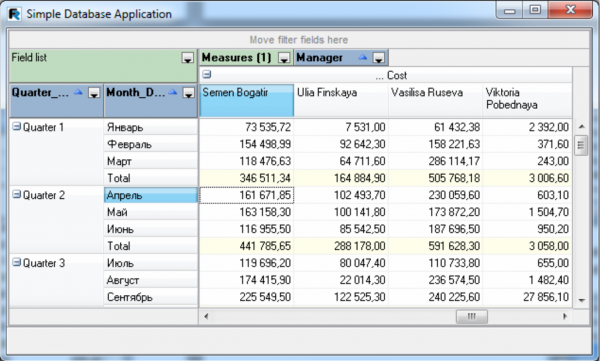
What if we are interested in sells by quarters? Drag the "Quarter_Date" to the rows, place it before the field "Month_Date" and here we are.
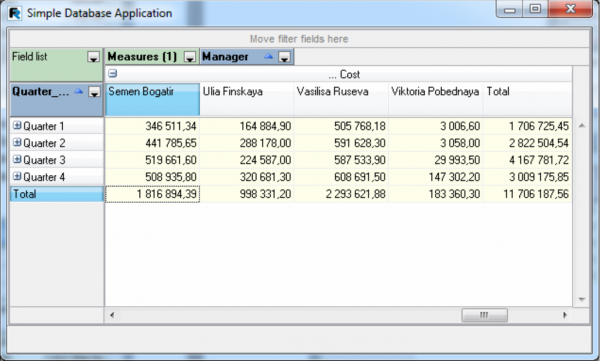
If we don't need information by month we can drag the "Month_Date" out to the filters area or completely remove it by drop it to the "Field List". Or we can just drill up the dimension "Quarter_Date". To do this click on the button with the "-" sign on the appropriate quarter value. Or we can roll up the month dimension if we hold down the "Ctrl" key during the click.
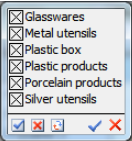
If we are interested only in particular product information like "Plastic Box" then we need to drag the field "Product" to the filters area and open the drop-down list of the field. It contains the values of the "Product" field. As we see, all the values is checked - this means that the pivot table is not filtered by the product type.
Uncheck all product types except the "Plastic Box". It's enough just to uncheck "Plastic Box", and then make an inversion (click on the "inversion" at the bottom of the list):
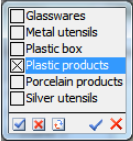
The data in the pivot table has changed. Now it has only plastic boxes sells.
Thus with the simplest actions in the FastCube pivot table we've got results for the different criteria and groups and have not touched the programmer. And the programmer has used just a line of code to give the user this possibility.
It is worth to say that we can simplify the life further both for the user and the programmer. FastCube allows saving pre-existing structures (schema) of pivot tables and loading them if needed. Thus, the user can immediately get the required pivot tables without any dragging or filtering. Schemas can be saved in files or in a database.
Salesdb.mdb database and project: Archive
Open the drop-down list "Field List". We see the list of fields from the source table in it. Note that the list contains the fields "Day_Date", "Day_of_week_Date" and others which were not present in the "Sales" table. These fields are automatically created for the "Date" field and we can use them to build slices by date parts or for filtering.