Verwendung von SVGObject in FastReport .NET 2018.2
Format SVG (Scalable Vector Graphic) was developed in the late 90's to display vector graphics in Web sites. The basic idea behind it is the use of XML for describing the image. This made SVG very popular in the web graphics. Using css or java script, it's easy to change the XML description of an image. Accordingly, it is easy to make an animation or just change the color.
Based on this, you can identify the main advantages and disadvantages compared to other formats popular in the web graphics, such as png and gif.
Advantages:
- small size;
- Flexibility. With CSS, you can quickly change the graphics settings, such as the background color or the position of the logo on the page;
- ability to resize the image without changing the quality. This is a feature of vector graphics;
Disadvantages:
- A large file size if the object consists of a large number of small elements.
As you can see, there are very few shortcomings.
In FastReport.Net, we can export the report to SVG format. But now we will talk about something else. Specifically, about the SVG report object. That is, about the possibility of inserting an SVG vector image into a report. For this, an SVG ![]() object is provided on the toolbar in the report designer. Previously, this object was available as a plug-in to the report designer. Now it is included in the library.
object is provided on the toolbar in the report designer. Previously, this object was available as a plug-in to the report designer. Now it is included in the library.
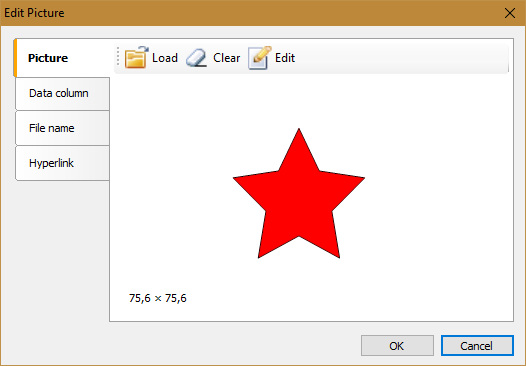
This object is inherited from the Picture object, so the editing window is almost the same for it.

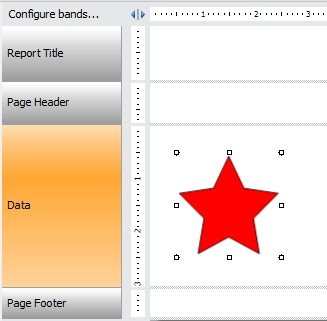
And on the report page, the SVG object has no difference from Picture:

To scale the image, simply drag the object with the mouse:

If you export this report in HTML format, the image will be exported as svg file, in html code the link will appear:
1 |
<img src="SVG.D366E814F147C36F912200FCD8949836.svg" alt=""/></td>
|
To create an SVG object in the application code, use:
1 |
FastReport.SVG.SVGObject svg = new FastReport.SVG.SVGObject();
|
Restrictions - the object is currently supported in the assembly for .Net Framework 4. In the future, .Net Core support is possible.