How to use multiple databases in a report
Sometimes, we have to deal with data from different sources, in different formats. This can be a real headache for analysts and report developers. After all, you have to somehow combine the data. Fortunately, in the reports of FastReport.Net you can create many data connections. Moreover, data sources can be completely different - text files, databases. Thanks to this, we will be able to consolidate the data in one report.
In this article, we will look at the way to create two data sources in a report and to link tables from them to create a report with the main and subordinate table. Only two tables and two files. The first is in the csv format, the second one - in json.
Plugins
Plugins are provided for the FastReport.Net report designer. They are extensions to add new functionality. These can be additional connectors to data sources or additional controls for the report. In our example, we need to connect to JSON. Therefore, we will add a plug-in with a connector to the data source of the JSON file.
To get the plug-in connector in JSON format, we need to build the corresponding project. It is located here:
C:\Program Files (x86)\FastReports\FastReport.Net\Extras\Connections\FastReport.Json
All you need is to restore one NuGet Newtonsoft.Json package and build a project. In the Debug or Release folder you will find two libraries: FastReport.Json.dll and Newtonsoft.Json.dll. The first is the plugin for the report designer.
How to add a plugin
Run the report designer. In the File menu we find Options. In the report designer options, go to the Plugins tab:
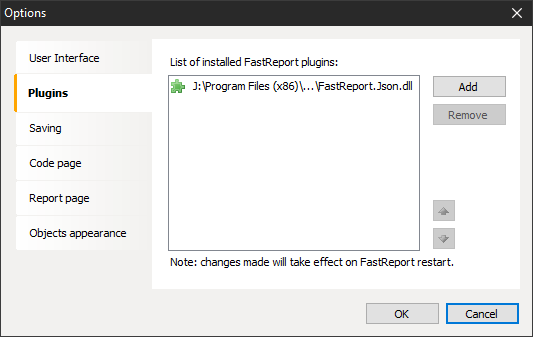
And add the plugin created by us. To use it, you need to restart the report designer.
Let's start creating a demo report. Create a new data source using the button:

In the new window of the data source creation wizard, click the New connection button ...
In the connection settings window, select the connection type. From this particular list we choose new connections to be added. We add them using plugins. Now we are interested in the standard connector - CSV database. Select it and set the path to the data file:
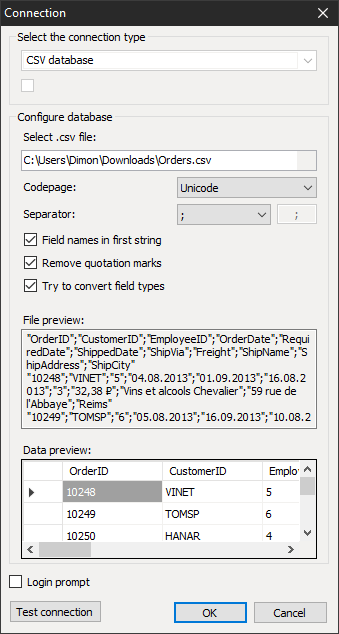
As you can see, there are some more important connection settings in this window. In the window below you can see how the table will look like. Click OK and proceed to the next step of the data source wizard. Here you just need to mark the table with a flag and complete the creation of the source.
Let's create a second data source. This time we select the connection type - JSON database.
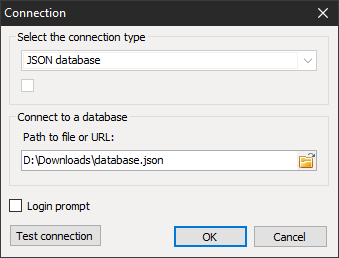
From the settings here we have only the file selection. Also, as in the first case, select the table and complete the creation of the data source.
So, we have two tables - Orders and Customers. In the Orders table there is an external link to Customers.
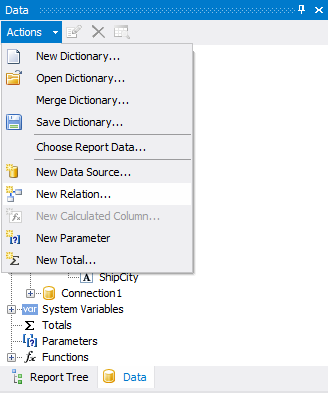
Our task is to bring out the names of clients and the list of orders for each of them. In this way, you get something like a grouping of orders by customer. This type of report is called Master-Detail. To implement our plans, you need to create a relationship between the tables. In the Data window, click the Actions button. In the drop-down list, select New Relation ...:
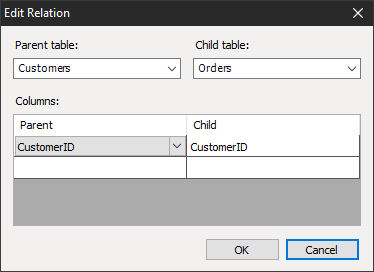
In the relation editing window, we set the parent table, which has a one-to-many relationship. Also we set the subsidiary table. The next step is to set up columns for communication. Briefly speaking, we select the external key in the parent table and the primary key in the subsidiary table:
You can see that the tables are related by this characteristic element in the data tree:
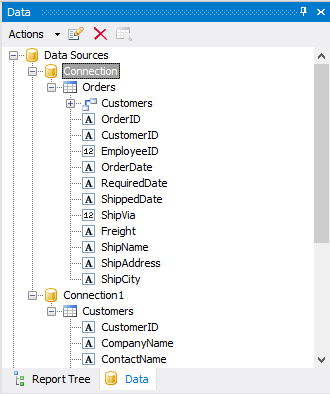
The Customers element has been added to the Orders table, which can be opened by clicking on the cross. This means that the Orders table has a detailing Customers table. There can be many such detailing tables, there is no limit.
The data is prepared; you can create a report template. Drag the required fields from the Customers table to the “Data” band. For our example, the CompanyName field is sufficient. Then we right-click on the “Data” band, and select Add Detail Data Band from the context menu.
Thus, we add the subordinate band “Data”. Drag the required fields from the Orders table to the added band.
Add Detail data band.
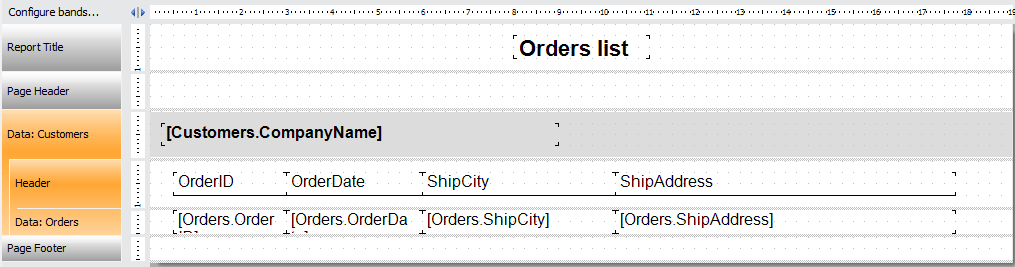
We make a report template and run the report in the preview mode:
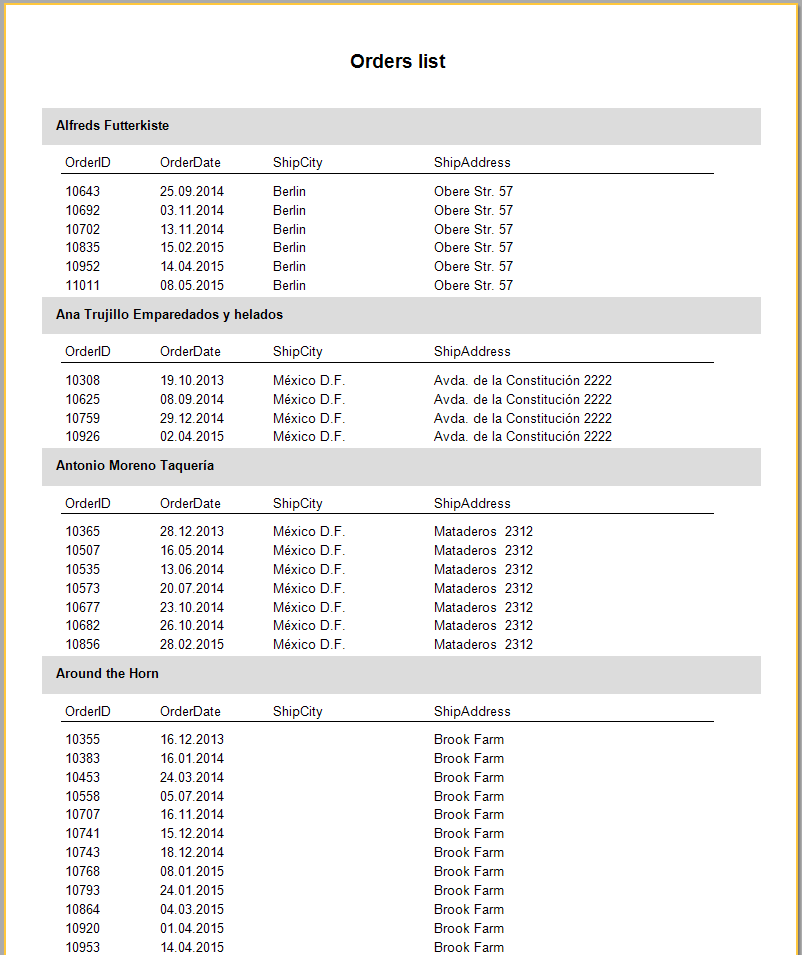
As a result, we obtained logically related tables obtained from completely different data sources. Thus, you are not required to bring data into a single format, which will greatly facilitate the development of reports to those who often work with a variety of data.