How to make a report like Master-Detail
The variety of electronic documentation sometimes seems to be limitless. However, in practice, not many types of documents are commonly used.
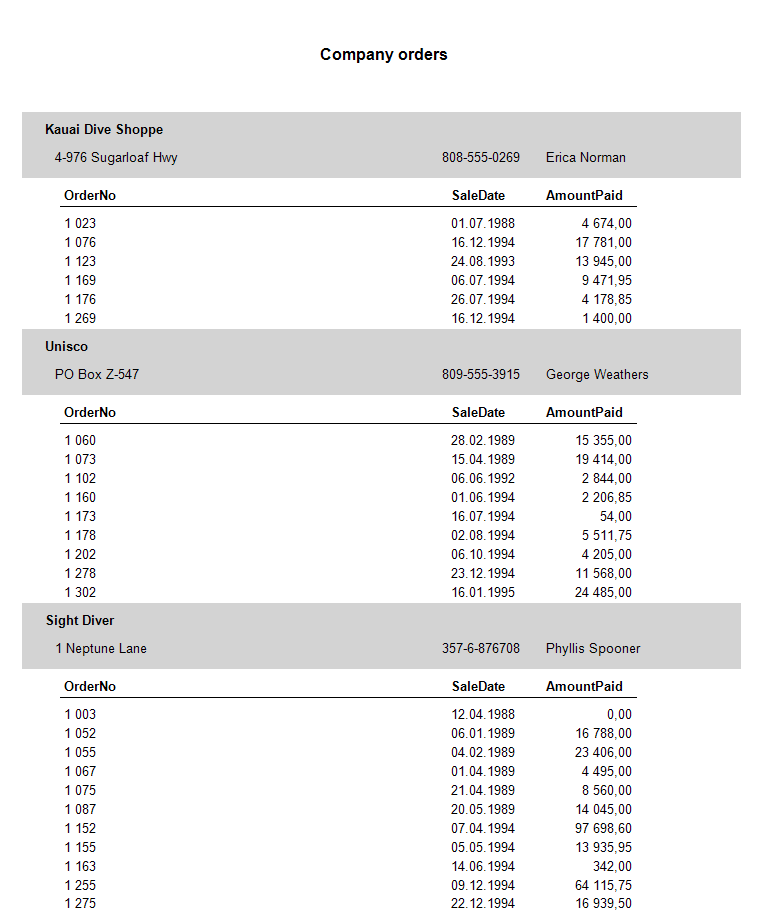
In electronic reporting, the most common type of document is a simple list. Then, there go complex lists. There can be many variations of complex lists, but the main one is a report of the type “Main” - “subordinate”. The essence of this type is that there is a dependency between data entities in a one-to-many scheme. That is, one record in the main table can correspond to several records in the subordinate. In practice, it looks like this:
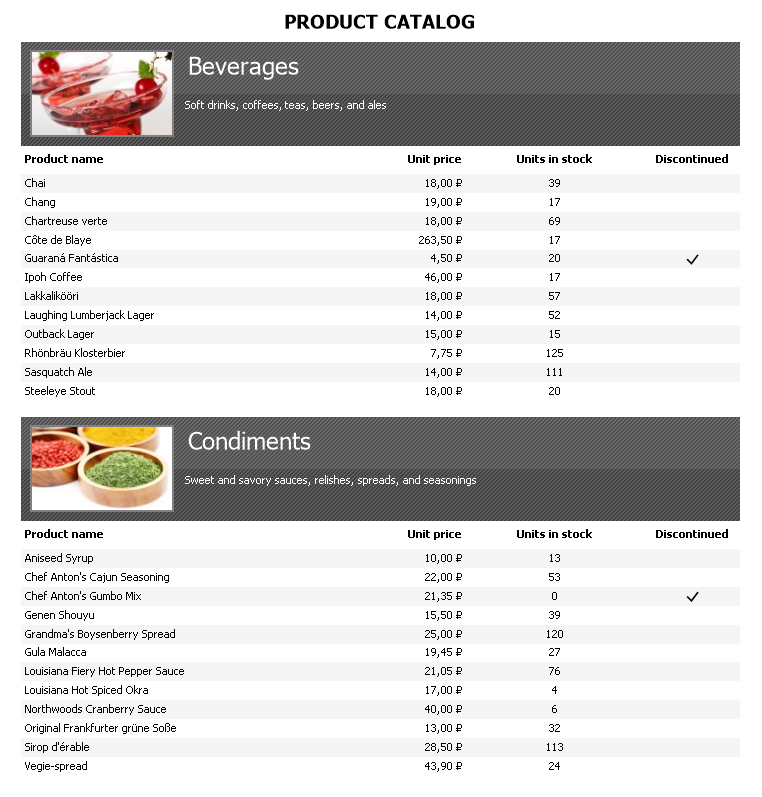
Entries from the main table contain the name of the categories, their brief description and picture. Each category contains specific products. This example shows only one dependency “Main” - “subordinate”. But the subordinate table can also have its subordinate table, and then it will already be the main one for the second connection. Such hierarchical dependencies can be arbitrarily many. And now in practice, let’s consider how to create such a report.
First of all, we need a data source in which there will be two logically related tables, as in the example shown above.
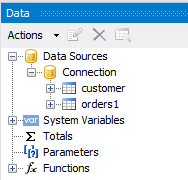
Add a data source to the report. In our case there will be two related tables:
customer and orders.
In the “Data” window it looks like this:
Now we need to link these tables. To do this, click the Actions button in the data window. A drop-down list will open:
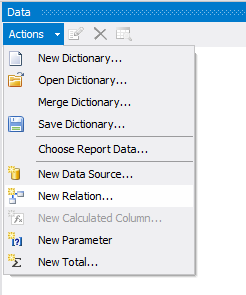
You need to select the item “New Relation”. In the relation edit form, we need to define the main and subordinate table, as well as the field by which they should be linked:
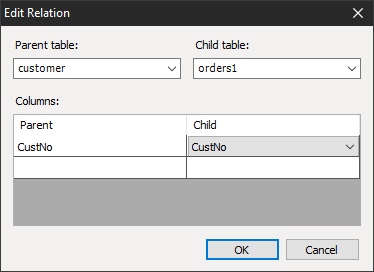
The main table is ‘customer’, its primary key is CustNo. The subordinate table is ‘orders1’, its foreign key CustNo. After successfully creating the connection, we will see it in the data window:
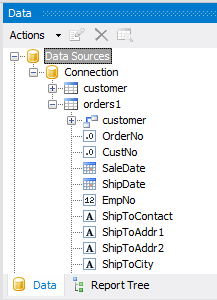
As you can see, a link to customer appeared in the orders1 table. If you open it, we will see all the same fields that are in the customer table.
We have prepared the data, now you need to create a report template.
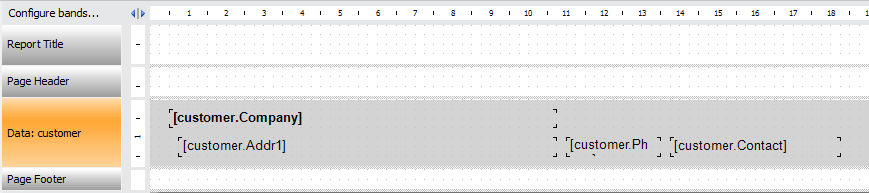
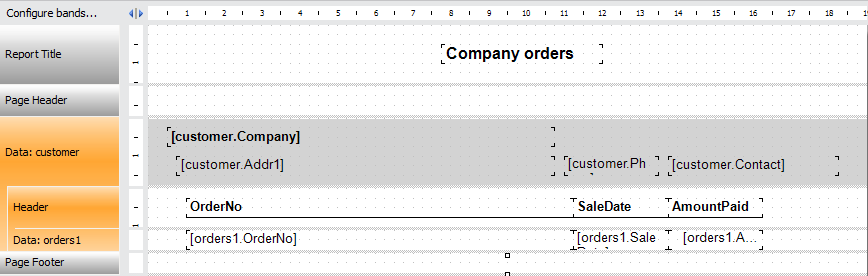
By default, a single band Data is available in a blank report. Let's add some fields from the customer table: customer.Company, customer.Addr1, customer.Phone, customer.Contact. We will place these fields so that we get a certain company card:
Right click on the band header ‘Data’:
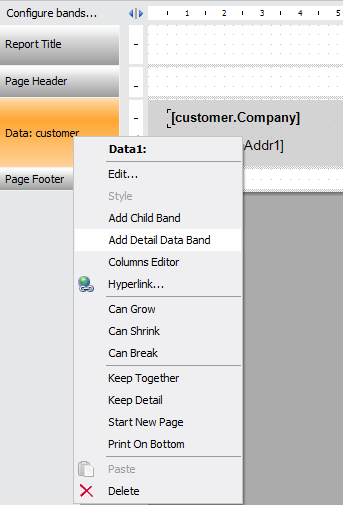
And select the item “Add detailed data band”. Click on the Configure bands ... link:
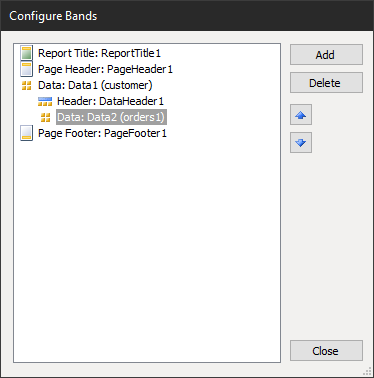
And add a header band for the Data2 band. To do this, select the Data2 band with the mouse and click the Add button. In the drop-down list, select Header.
After that, you can add fields from the orders1 table to the detailed “Data” band: orders1.OrderNo, orders1.SaleDate, orders1.AmountPaid. At the same time column headings will be added automatically. Format the headers, and our template is almost ready:
Double-click on the header of the “Data” band:
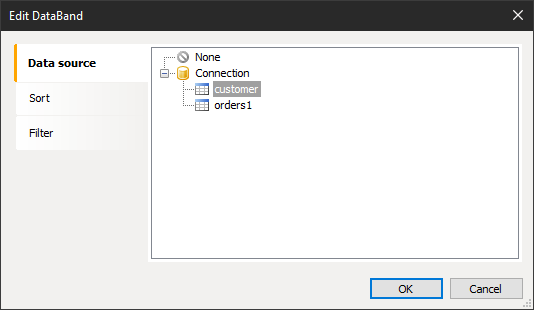
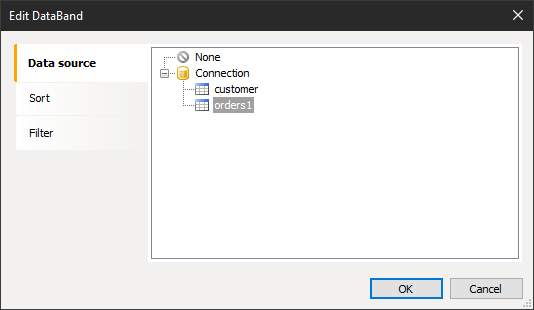
We select the customer table as a data source. Now let's do the same for the detailed “Data” band:
Now our report is ready to run. Let's see what we got: