How to draw a chart based on custom variables
An important part of the report is a graphical component, namely graphs and charts. They allow you to quickly analyse the data to assess the trend of growth or fall, or just quickly read information. That is how human perception works, that the graphic information is received more quickly. Therefore, on the road signs, you can see the images that are immediately understood and interpreted by the brain immediately.
Charts and graphs are based on statistical data. As a rule, they are taken from the database. But there are situations when it is necessary to build schedules based on the converted data. For example, using the initial data calculations performed. Some report generators allow only ready source of data. It is not convenient, because the conversion of the data necessary to carry out the report.
Let's look at the problem that the List & Label report generator user raised in his question:

To implement this in List & Label, you will have to create an intermediate table and write data from variables into it. The thing is that a pie type chart only works with a tabular data source. Chart segments are calculated by aggregating data.
Generator FastReport.Net reports can be used in the charts the data from the source, and the data manually added in the editor. However, the FastReport reports have built-in script that "unties our hands" and provides the ability to customize graphics in the code. This means that we can "slip" any data in the graph. For example, you perform calculations in a report, and save the results in the report variables, and then want to build on them graph. It is quite easy to implement.
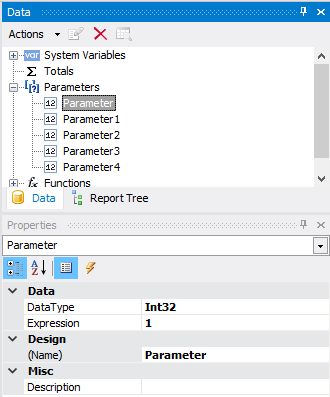
You can also add MSChart object on the report page and create event handler BeforePrint:
1 2 3 4 5 6 7 8 9 10 11 12 13 14 15 16 17 18 19 20 |
private void MSChart1_BeforePrint(object sender, EventArgs e) { MSChart1.DeleteSeries(0); //Delete default series MSChart1.AddSeries(SeriesChartType.Pie); //Add new series with pie-chart MSChart1.Series[0].SeriesSettings.Points.Clear(); //Wipe series data //Look through all parameters in the report foreach (Parameter param in Report.Parameters) { //Add to a series a point on Y axis. For the pie-chart Y axis are enough MSChart1.Series[0].SeriesSettings.Points.AddY(param.Value); } //Enable the legend MSChart1.Chart.Legends[0].Enabled = false; //Set series labels of the pie-chart MSChart1.Series[0].SeriesSettings.Label = "#VALY"; //Set height of the MSChart object MSChart1.Height = 500; //Set width of the MSChart object MSChart1.Width = 500; } |
As a result, we will have such pie-chart:
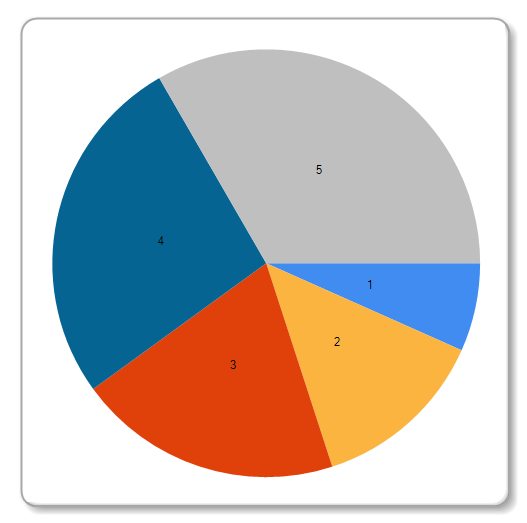
In this example, we used the parameters of the report as a data source, but you can also use variables in the script of the report, arrays, collections.
Unfortunately, in the official documentation to FastReport.Net there is no description of the properties and methods of MSChart object. This component is very complex with a lot of settings, so you'll have to spend some time finding the right properties experimentally. In this example I have shown the simplest way of quickly creating graphics with the minimum settings.