Overview of new features of Online Designer in version 2018.2
The new version of Online Designer has acquired five innovations. These innovations have touched both usability and functionality. But first things first.
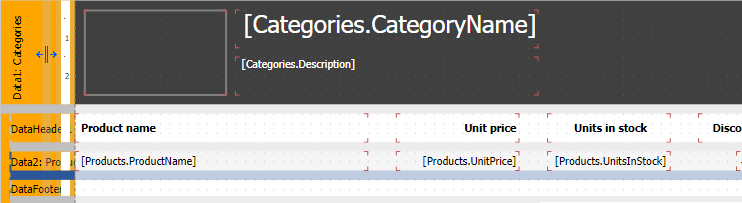
1. The possibility of horizontal band resizing has been added.
This feature allows you to change the width of the band headers. When can it be necessary? If the band headers do not fit in the visible area, now you just stretch the title with the mouse. Hover your mouse over the darkened strip, as shown in the figure below.
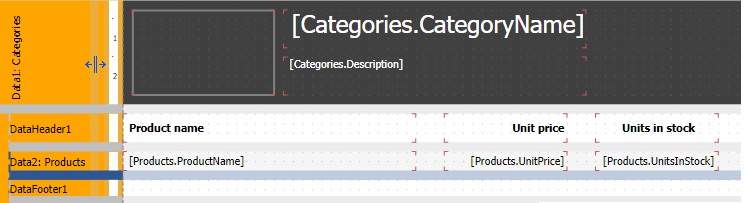
And pull it to the right.
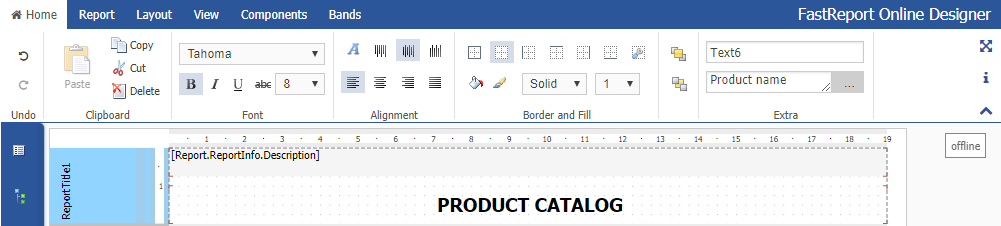
2. Added offline work of the designer with service workers.
This is the most important innovation of version 2018.2. Now, thanks to the technology of service workers, you can work with Online Designer in networks with an unstable signal. That is, having lost connection to the Internet, you can continue working with the report and save it. In fact, the report will be saved to the remote server after the connection is restored. Thanks to the feature of Offline work with the report designer, the fault tolerance of the program has increased.
3. Added notifications online / offline.
In the continuation of the previous new functionality, there appeared notifications about the disruption and restoration of the Internet connection.
This is how the connection loss looks like:
And this is how restoring the connection to the Internet looks like.
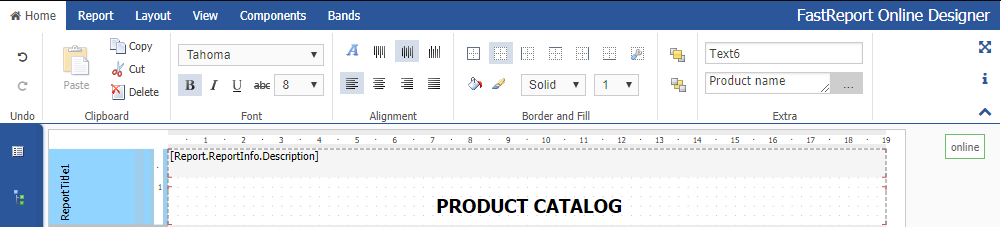
The notifications appear for a few seconds and will not be displayed permanently.
4. Added the Editable property for text objects and checkboxes.
This property appeared in FastReport.Net 2018.2. Now it is available in OnlineDesigner. The essence of the property is that it makes it possible to edit the text field or checkbox when viewing the report in the preview mode or the built report (including the Web report).
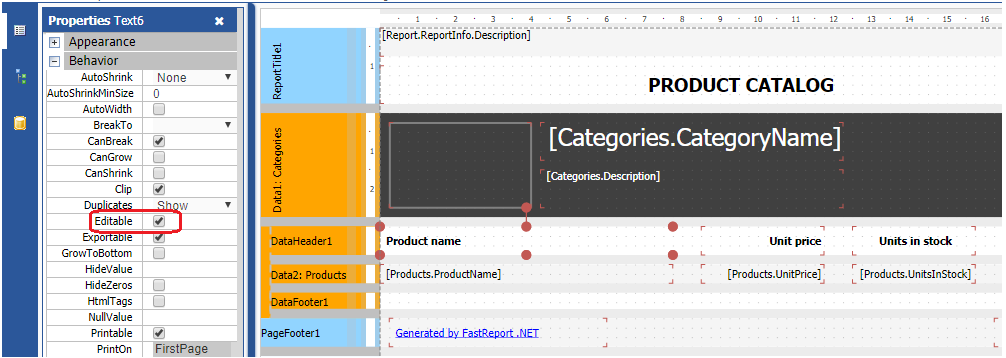
To set the Editable property, select the text object or the checkbox object with the mouse. Open the Property inspector using the first icon on the sidebar. Find the Editable property and select the check box for it, as it shown in the figure.
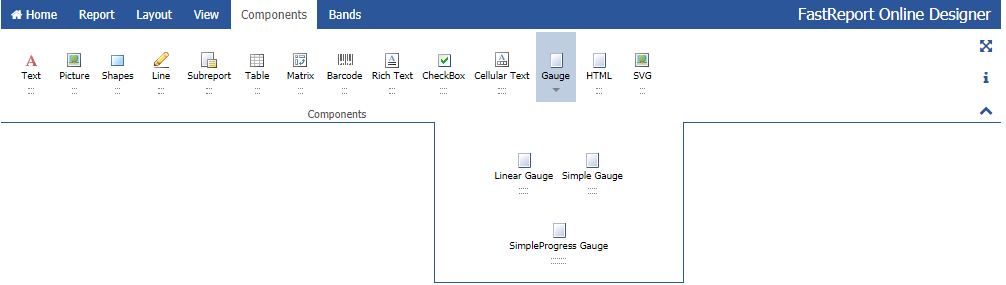
5. Added the SimpleProgressGauge component.
This component is added to the existing Linear Gauge and Simple Gauge. The whole group of components is designed to indicate the state of something. The new component is meant to indicate the state of progress.
And it looks like this:

You can connect a data source to it, change the fill color, the font of the label, and so on.