Complex report with Advanced Matrix in FastReport .NET
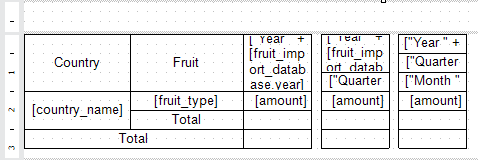
This article continues the previous article, in which we looked at how to create a complex report. The report created in that article has become a source of inspiration for a new object - AdvancedMatrix.
The report in the previous article included three sections:
1) yearly statistics;
2) quarterly statistics;
3) monthly statistics.
Each of the sections was implemented using a separate matrix, which had to be done due to the limitations of the standard MatrixObject. In the new version of FastReport .NET, we have added an updated version of this object, which is called AdvancedMatrix. It allows you to develop the entire report in one matrix. Let's see how to do it.
Add an AdvancedMatrix object to the empty data band:
Let's remember what the data we use looks like:
For the simplest matrix, we need to drag three fields: country_name, fruit_type and amount.
Here's what the matrix looks like now:
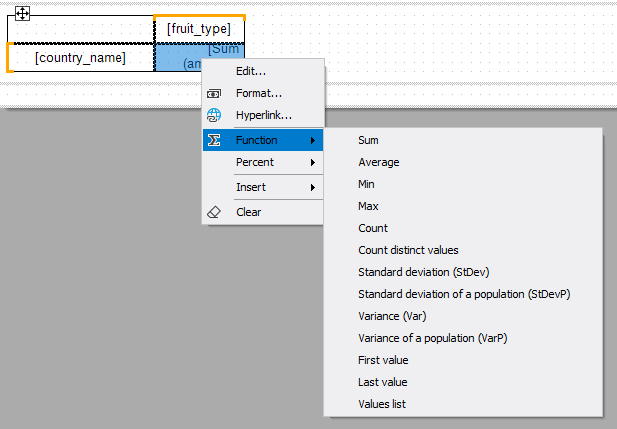
The new matrix allows you to change the calculations in the cells. In this case, we need the amount, but we can replace it with something from the following list:
Let's remake the matrix. We need the fields country_name and fruit_type to be used in grouping — the report should group the list of fruits by country, and there should be a column for each individual year:
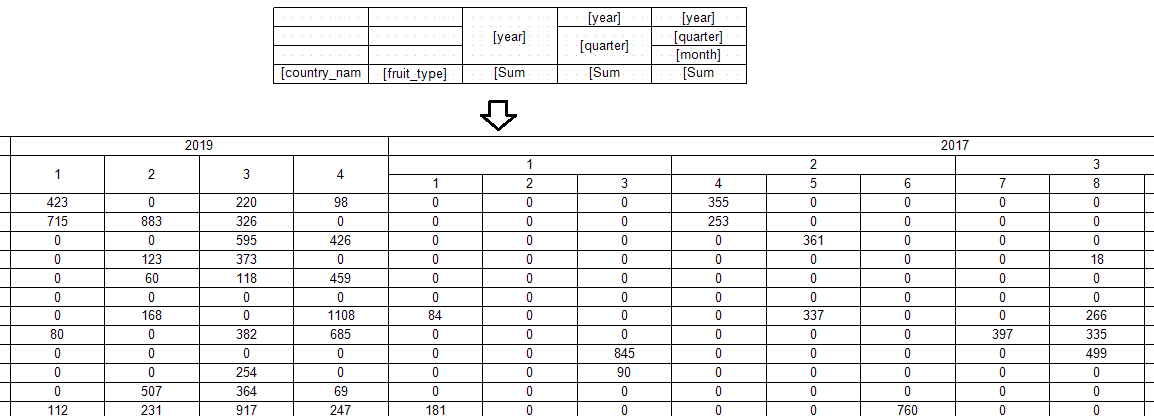
At this stage, we go beyond the capabilities of a regular MatrixObject. Let's add additional fields year and quarter to the matrix, and also replace empty values with zeros:
What we previously had to do with two matrices can now be done with just one. Now we have a breakdown both by years and quarters. Let's go even further.
At this stage, we have a matrix with all the necessary data. To increase readability, we can change the display of the matrix and data.
First, let's merge the cells with the only text:
A new menu for editing titles can help with displaying data:
Now the matrix looks like this:
Finally, we can compare the report preparation speed when it consists of three regular matrix objects and when it consists of one large matrix.
The test was done on a computer with an AMD Ryzen 5 3600 and 16GB of RAM. There are 5000 records displayed in the data table.
|
Attempt |
3 matrices of MatrixObject |
1 AdvancedMatrix |
|
#1 |
906 ms |
656 ms |
|
#2 |
828 ms |
625 ms |
|
#3 |
937 ms |
640 ms |
|
#4 |
875 ms |
641 ms |
|
#5 |
891 ms |
672 ms |
|
#6 |
922 ms |
656 ms |
|
Average: |
893.3 ms |
648.3 ms |
As you can see, preparation time drops by ~27% on average, which can save a lot of time on reports with many data.
In this article, we showed you how to recreate the report from the previous article. Advanced Matrix allows you to implement several useful features - for example, the TopN filter sort for selecting the 5 records with the highest calculated values.
You can learn about all the features of this object in our documentation.


