What reports can FastReport .NET WPF do?
Practically any: invoices, financial reports, product catalogs with color profile support, restaurant menus, sales details, questionnaires with electronic forms, airline tickets, utility bills, and much more. If you have data that needs to be made visually understandable, FastReport is the perfect solution for you.
Features and Benefits WPF
Template designer
The standalone desktop report designer is the heart of FastReport. It allows both developers and users to create, edit, view, save, export, and print custom reports without much hassle. The designer can be used at run-time. This will allow your users to independently edit existing documents and create new ones. The designer can also be used in MDI (Multi-Document Interface) mode to work with several reports simultaneously.
Localization is supported for more than 25 popular languages of the world.
FastReport .NET WPF is a band-oriented report generator. A rich set of bands allows you to build reports of any type: list, master-detail, report with grouping, multi-column, master-detail-detail, and others. If you need to create many reports that contain the same elements (header, footer, company details, logos), then you can collect common elements into a base report and inherit all other reports from it. We also support subreports.

Data processing
FastReport .NET WPF works with ADO .NET data sources. It supports data sorting and filtering, master-detail relationships. Everything can be configured with a few clicks. It is possible to connect to ADO, MS SQL, and XML databases. Connectors are available for connecting to other types of databases, and you can also obtain data from business objects of the IEnumerable type.
Your report may contain data (tables, queries, database connections). This way, you can not only use the data available in your application but also independently connect to any database directly from the report. FastReport .NET WPF contains a scripting engine that supports C# and VB .NET. You can harness the power of .NET in your report for complex data processing, dialog form management, and more.
The report may contain dialog forms to request parameters before the report is built. Dialog controls support the ability to connect to data and then filter it. Filtering can be added to absolutely any report; it does not require writing any code. Using the visual query builder, you don't need to know SQL to build a complex query from multiple tables.

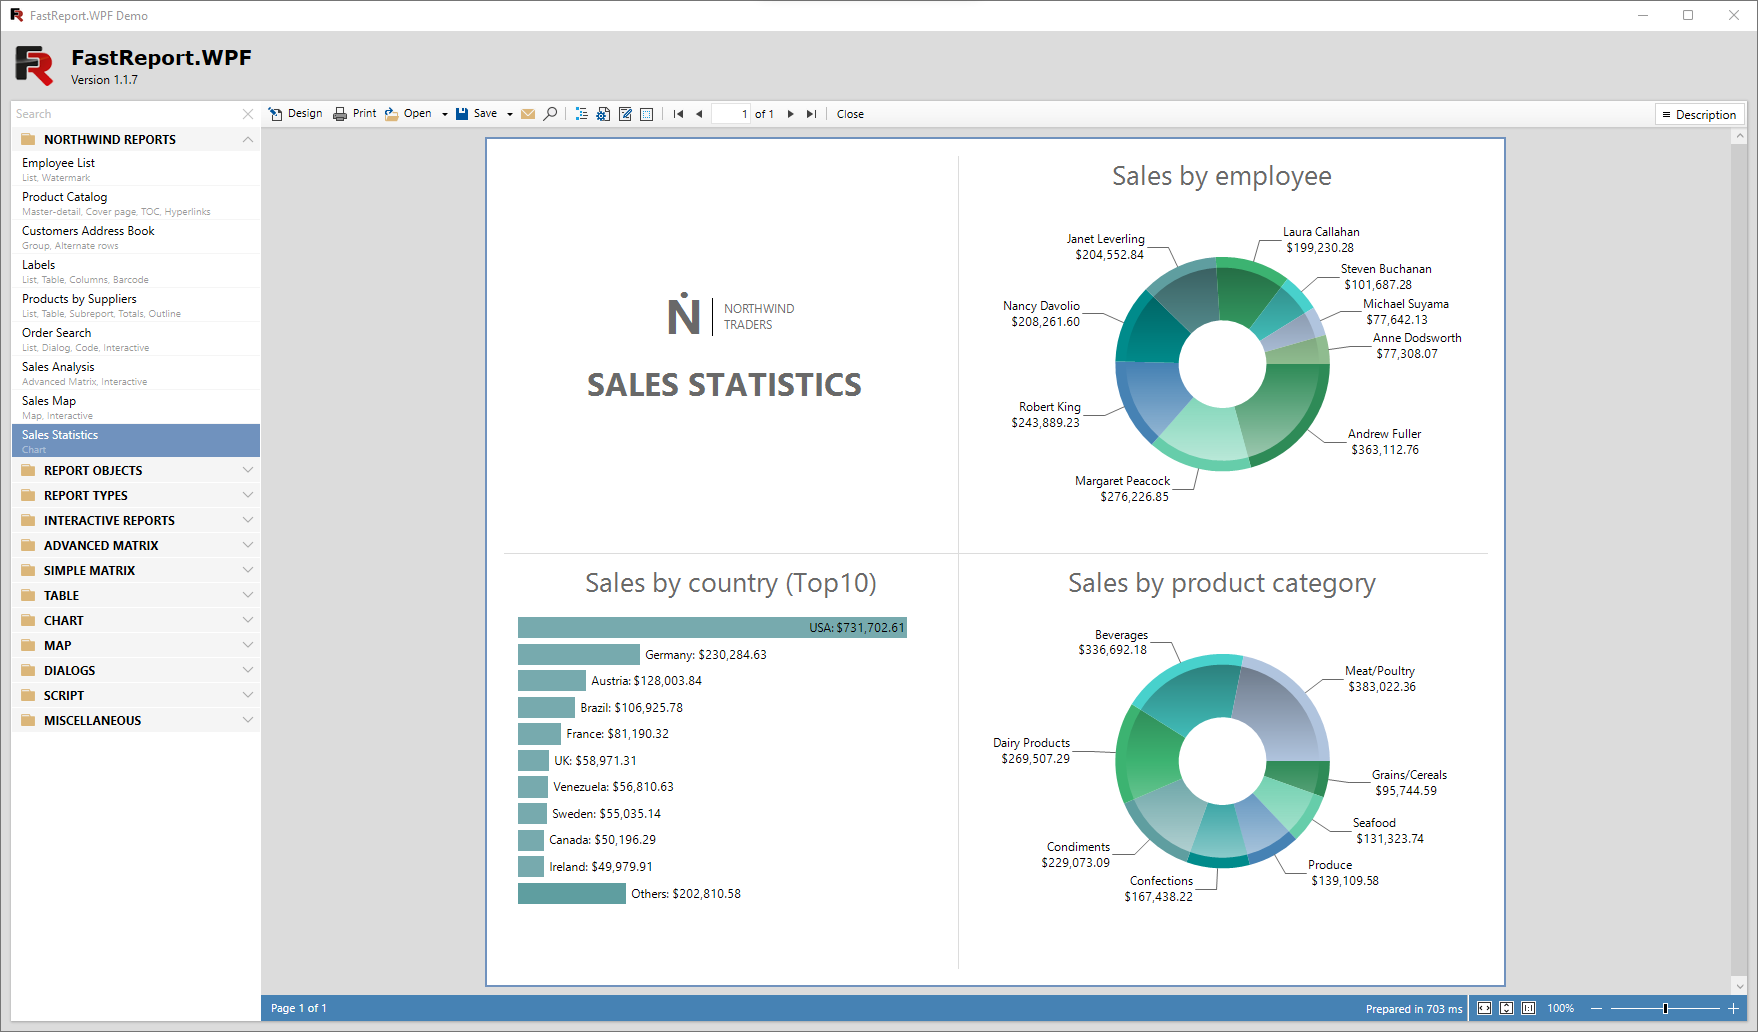
Preview and print
The pre-prepared report can be examined in detail in the Report Viewer's preview window. Our component supports working with parameters, multi-level detailing, and interactive reports. You can define a response to a mouse click on an object in the preview window. For example, you can build and display another report that shows detailed information about the object the user clicked on.
Additional printing settings. The following options are available to you: cutting large report pages into small ones, printing several small pages on one large one, and printing in a given format with scaling. Do you need to print a report containing A3 pages on a regular A4 printer? Now, this is not a problem!

Exports to convenient formats
Filters for exporting the finished report to many formats: PDF, RTF, XLSX, XML, DOCX, TXT, CSV, PowerPoint, HTML, MHT, XPS, JPEG, BMP, PNG, Open Document Format (ODT, ODS, ODP), XAML, Scalable Vector Graphics (SVG), DBF, PPML, etc. Cloud support: OneDrive, Google Drive, Box, Dropbox, FastReport Cloud.
FastReport .NET WPF allows you to quickly convert reports with editable fields (such as text fields, combo boxes, checkboxes, radio buttons, and graphics fields) into PDF documents without connecting additional libraries. Save your reports in popular formats: PDF 1.5, PDF/A-1a, PDF/A-2a, PDF/A-2b, PDF/A-2u, PDF/A-3a, PDF/A-3b, PDF/X-3 and PDF/X-4, which are secure, accessible and reliable.

Ultimate .NET
This set of components is part of the Ultimate solution, with which you can create your business projects on all modern .NET, ASP.NET, Blazor, WASM, WPF, WinForms, Avalonia UI, Mono, and other platforms. With your team, you can work both in the desktop designer and directly from the browser. The Ultimate package also includes components for data visualization, namely business graphics with a set of charts and OLAP products for fast processing of large data sets.
Delivery options
| Features |
from $1,499
|
from $499
|
|---|---|---|
| FastReport Engine |
|
|
| WEB components |
|
|
| WinForms components |
|
|
| Avalonia components |
|
|
| WPF components |
|
|
| Mono components |
|
|
| Online Designer |
|
|
| FastReport.Drawing (Skia) |
|
|
| System.Drawing (GDI) |
|
|
| Report script engine |
|
|
| Data connections |
|
|
| Reporting features |
|
|
| Report objects |
|
|
| Barcodes |
|
|
| Charts |
|
|
| Printing |
|
|
| Export in formats |
|
|
| Transports |
|
|
| Convertors from |
|
|
| Plugins |
|
|
| Custom plugin support |
|
|
| Source Code |
|
|