How to use Steema TeeChart in combination with FastReport .NET
TeeChart is a library of charting. It is widely known among the programmers of the VCL platform of programmers, but it is also popular in other platforms, for example, in the .Net Framework.
FastReport .NET, since version 2018.2 supports this component in its report designer.
To add a new control element to the report, you need to apply the plug-in for the report designer. We will collect it from the project located in a folder C:\Program Files (x86)\FastReports\FastReport.Net\Extras\Misc\TeeChartObjectPlugin.
Run the report designer. On the File menu, select: ![]() .
.
On the "Plugins" tab we click the "Add" button:
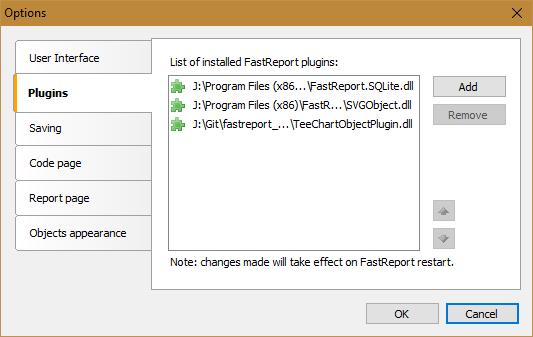
Choose the compiled library TeeChartObjectPlugin.dll. Click OK and restart the report designer. Now, on the toolbar, there is one more element - ![]() Steema TeeChart. Add it to the report page:
Steema TeeChart. Add it to the report page:
![]()
Chart data settings are set in the properties of the TeeChart object. We need to connect the data source to the TeeChart object, set the data fields and add a series - a graph of a certain type.
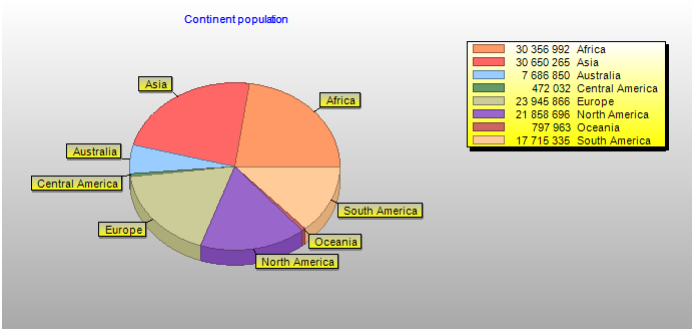
First of all, we will create a connection to the database in the report. I will use a table with data on the population on different continents.
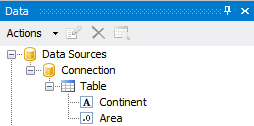
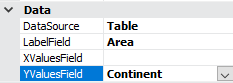
In the properties of the TeeChart1 object, we find the DataSource and select the Table. For the LabelField property, select the Continent field. And for YValuesField - Area.
To create a series of charts, double-click on the added TeeChart object. The chart editing window will appear:
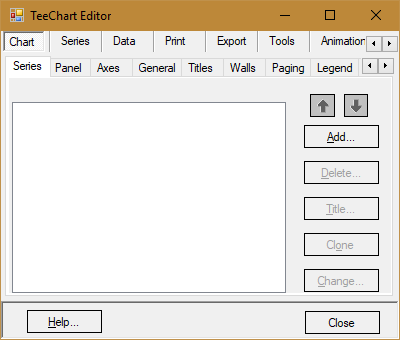
On the Chart tab we can add a new series with the Add button. Click it:

We are invited to choose the type of the series. Since the functionality of the TeeChart library is very impressive, we have many types of series available on separate tabs according to the purpose. For our simple example, a standard pie chart is suitable. We choose it. In the Gallery Palette drop-down list, we can choose the color scheme of the series. Press the “Ok” button.
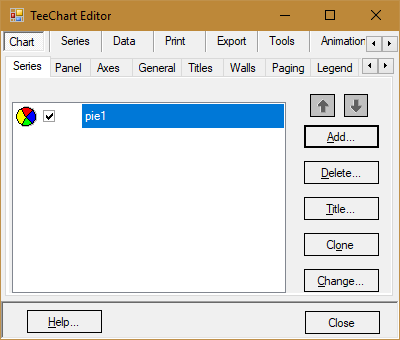
Now we have one series available. To edit its properties, go to the Series tab:
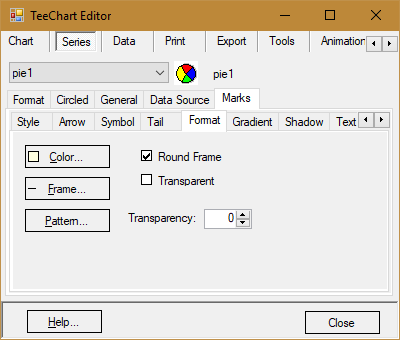
We have a lot of options available. For example, let’s change the frame in the series labels to a semi-circular one. On the Marks tab, select the Format tab. And note the property of Round Frame.
Now change the title of the chart. Let's return to the Chart tab in the top panel. For it, select the Titles tab at the level below:
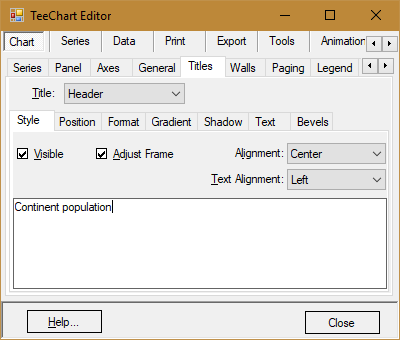
And change «TeeChart» to «Continent population».
Scroll the list of bookmarks to the very bottom. In the end, you will find the Themes tab, where you can select the theme of the diagram:
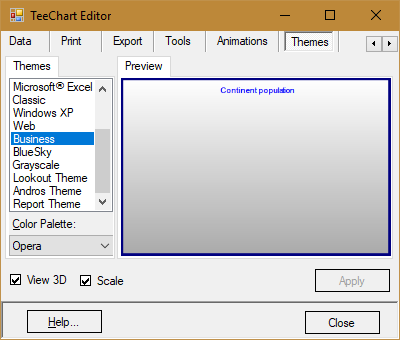
For example, Black Is Black. Click the Apply button to apply the theme. Close the chart editing window and run the report in preview mode:
Thus, using the TeeChart component is easy enough.