How to work with SHP maps in Delphi / Lazarus / С++ Builder
 ShapeFile, also known as Shape is a figure or a set of complex shape figures (probably, unrelated). A Shape field can be one of the following types of geometry: point, polyline or polygon.
It is also notable that together with a *.shp file, *.dbf file is formed and it contains the header information about our shapes. It is important that the *.dbf file has the same name as the *.shp file. The main .shp file stores geometric data indexed in a .shx file (index) and extended attributes with their values in a dBASE (.dbf). ESRI publications have a full specification of the ShapeFile format (.shp, .shx, .dbf) and use the full support among a number of GIS and CAD systems, they are widely used to represent all kinds of maps and cartographic diagram layers.
If one of the files from this set is lost, the data may be damaged or the project will be lost altogether.

ArcGIS is a geographic information system (GIS) for working with maps and geographic information maintained by the Environmental Systems Research Institute (Esri). It is used for creating and using maps, compiling geographic data, analyzing mapped information, sharing and discovering geographic information, using maps and geographic information in a range of applications, and managing geographic information in a database. Learn more about ArcGIS technology.
In the GIS context, vector data formats (or essentially vector data storage models) are one of the ways to display real-world objects.
You can open .shp files with the following software: CADE Pro, Parallels, Tools Center, AutoCAD, ESRI’s ArcExplorer, Free File Viewer Pro.
When should I use a shapefile?
- When exporting data for use in a non-Esri software application
- When exporting data for use in ArcView GIS 3 or ArcInfo Workstation
- When you need to write simple features and attributes quickly, such as for geoprocessing services (However, you must be aware of the limitations as detailed below.)
ShapeFile disadvantages
With some exceptions that are noted below, shapefiles are acceptable for storing simple feature geometry. However, shapefiles have serious problems with attributes. For example, they cannot store null values, they round up numbers, they have poor support for Unicode character strings, they do not allow field names longer than 10 characters, and they cannot store both a date and time in a field. These are just the main issues. Additionally, they do not support capabilities found in geodatabases, such as domains and subtypes. So unless you have very simple attributes and require no geodatabase capabilities, do not use shapefiles.
Geometry limitations
There is a 2 GB size limit for any shapefile component file, which translates to a maximum of roughly 70 million point features. The actual number of line or polygon features you can store in a shapefile depends on the number of vertices in each line or polygon (a vertex is equivalent to a point).
Shapefiles do not contain an x,y tolerance like geodatabase feature classes. The x,y tolerance is the minimum distance between coordinates before they are considered equal. This x,y tolerance is used when evaluating relationships between features within the same feature class or between several different feature classes. It is also used extensively when editing features. If you are performing any sort of operation involving comparison between features, such as use of Overlay tools, the Clip tool, the Select Layer By Location tool, or any tool that takes two or more feature classes as input, you should be using geodatabase feature classes (which have an x,y tolerance) rather than shapefiles.
A shapefile may take three to five times as much space as a file geodatabase or SDE because of shape compression methods.
Shapefiles support multipatches but lack support for the following advanced multipatch capabilities:
- Texture coordinates
- Textures and part color
- Lighting normal
The spatial index for a shapefile is inefficient compared to that of a geodatabase feature class. This means that spatial queries (such as selecting features within a polygon) take longer compared to a geodatabase feature class. This inefficiency is only noticeable when dealing with large numbers of features.
Parametrically defined curves(also known as circular arc curves) are not supported on shapefiles. Parametric curves are created by editing geodatabase feature classes, as described in Creating a curve. Circular arc curves use a mathematical formula to draw the curve. If you export a geodatabase feature class containing circular arc curve features to a shapefile, the curved features are transformed to simple line features with closely spaced vertices to capture the curved shape.
Unlike other formats, shapefiles store numeric attributes in character format rather than binary format. For real numbers (that is, numbers containing decimal places), this may lead to rounding errors. This limitation does not apply to shape coordinates, only attributes.
You can read more about ShapeFile here
You can read more about working with this format here
How to create a .SHP file using the code
We talked about the format itself and learned how to open finished files, but how to work with it in Delphi? There are three ways:
- GDAL - translator library for raster and vector geospatial data formats that is released under an X/MIT style Open Source License by the Open Source Geospatial Foundation. As a library, it presents a single raster abstract data model and single vector abstract data model to the calling application for all supported formats. It also comes with a variety of useful command line utilities for data translation and processing.
- MapWindow GIS – open-source GIS (mapping) application and set of programmable mapping components. This project is developed by Geospatial Software Lab, Idaho State University. The application runs only on Windows, it doesn’t support Linux OS. First of all, this project is very interesting to developers, because the core of this application is written in C++ and it is an ActiveX library that you can use separately from MapWindow and develop your own application to visualize and process geodata (it works in all development environments that support import of ActiveX components). You can read more about it here. Githab.
- And the best choice is to use FastReports. Why? Because it is ready to use! You take it, download it right away – lo and behold – it shows you everything! It’s like a Peking roast duck. If you cooked it yourself, you would have to pickle it for a week and, in our case, we’ve already pickled it for you! Come and eat it right away!
Creating a SHP map file
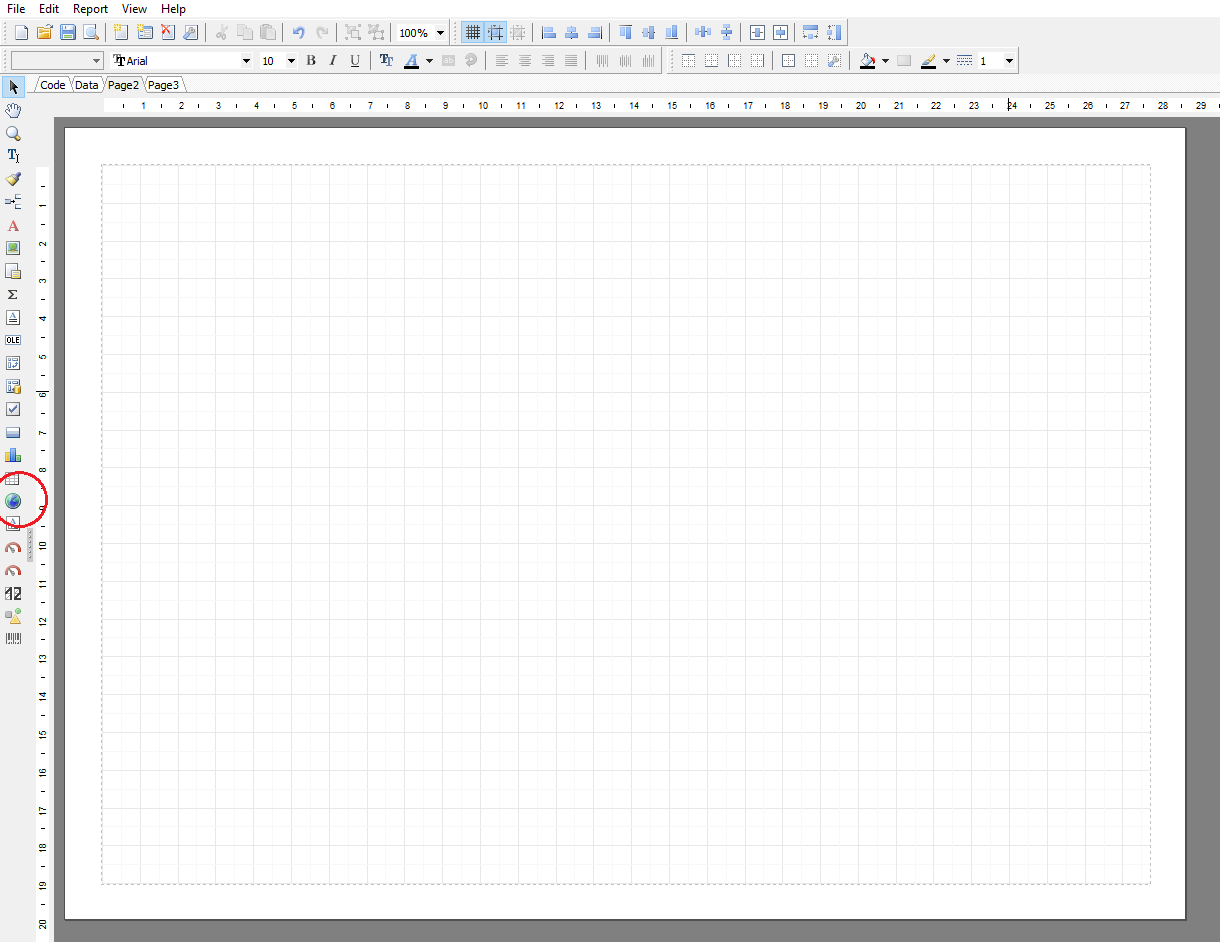
Go to the FR Designer. Find the Map Object and add it to the document.
A map editor should appear. The first tab contains general information.
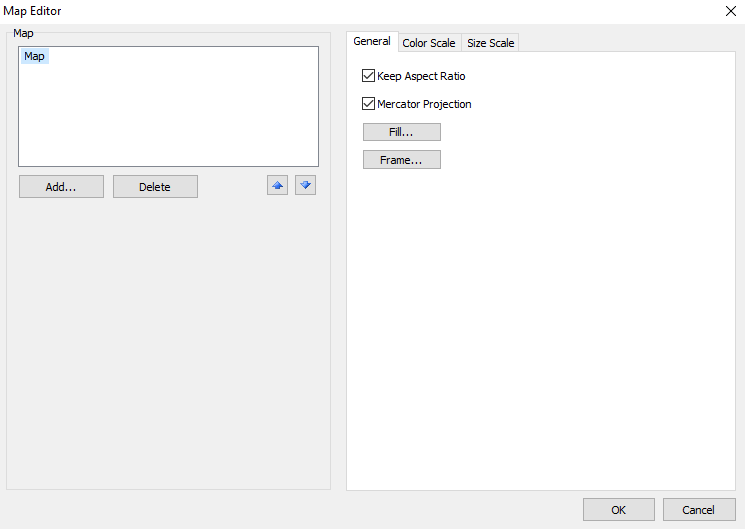
Map - set the name of our map. Also, map layers that can be moved using the arrows will be displayed here.
Add - upload a file in shp, osm or gpx format (in our case, SHP).
Delete - delete the map layer.
Keep Aspect Ratio - keep the aspect ratio.
Mercator Projection – use the Mercator Projection.
To add a new layer, click the "Add ..." button. The following window will be displayed:
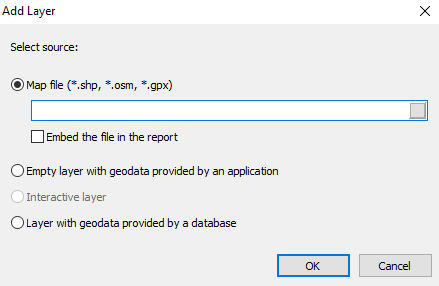
At this step, you need to select the layer type:
- map from the file (.shp / .dbf, .osm, .gpx). This is the most commonly used map type. For example, you can print a world map and highlight the countries where sales reached more than a certain value;
- empty geodata layer presented by the program. Your application should provide geographical coordinates (a pair of values – latitude and longitude), that will be displayed as a point on the map. A point may have a signature, as well as a different size and / or color, depending on some data. In practice, this map type is used as the second layer (the first layer – base one – is taken from the map file). For example, the base layer displays a map of a country, and the second layer – points with the names of cities where sales were made. The size and color of the point can be adjusted so that the sales level in a given city is comprehensible.
If you selected a layer based on a map file, you need to additionally specify how to store map data:
- The data will be implemented in the report file. Moreover, the report can greatly increase in size.
- The report file will refer to the map file, implementation doesn’t occur. This mode is useful if you have several reports using the same maps.
High-volume maps (over 30MB) or maps with a large number of polygons (over 20,000) will drastically slow down the report.
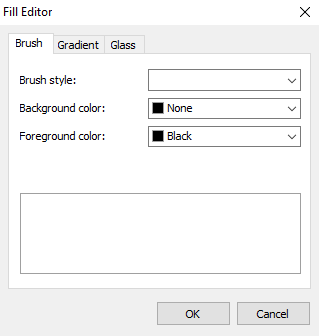 When we click on Fill button we get into the fill editor. There are 3 properties in the Brush tab:
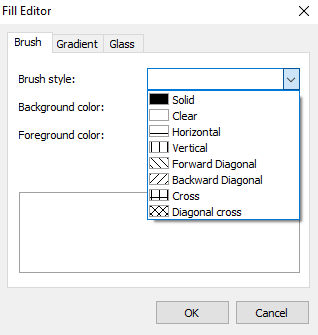 The brush style has several ready-made formats:
Solid – fill with a single color;
Clear – a clear background without any color;
Horizontal – horizontal lines for the whole background;
Vertical - vertical lines for the whole background;
Forward Diagonal - diagonal lines for the whole background;
Backward Diagonal - back diagonal lines for the whole background;
Cross - cross lines on the whole background;
Diagonal cross - diagonal cross lines for the whole background;
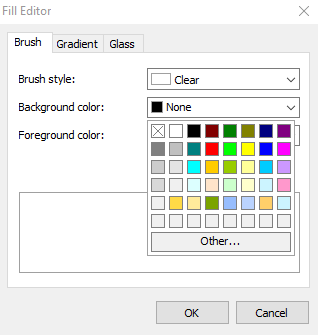
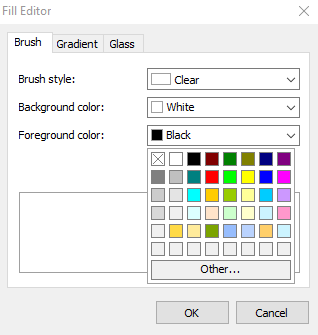
The background color, as well as the foreground color, can be selected from the ready-made color palette or set by clicking on Other button.

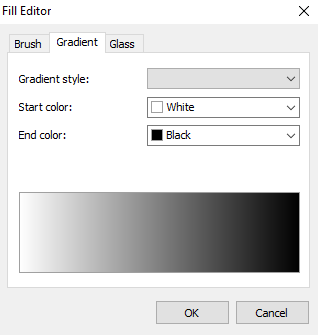
In the second tab, we have the gradient settings for the background.
The gradient style can be horizontal, vertical, oval, rectangular, vertical with a transition to a different color in the center, horizontal with a transition to a different color in the center.
The starting and ending colors can be selected from a ready-made color palette or set by clicking on Other button.
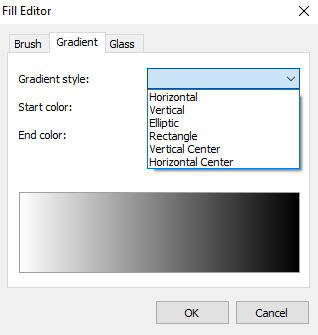
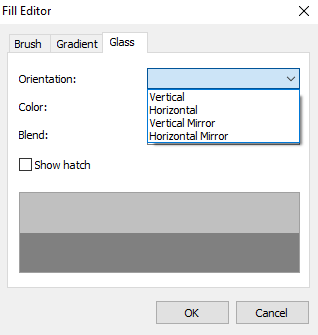
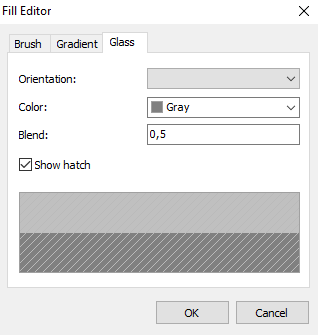
In the third tab we can see the Fill editor in the form of glass.
There is a choice of orientation: vertical, horizontal, vertical and horizontal mirror.
You can select a color from the ready-made palette or set the desired color by clicking on Other button.
Blend – color mixing coefficient (in the screenshot the value is 0.5)
Show hatch – display hatching.
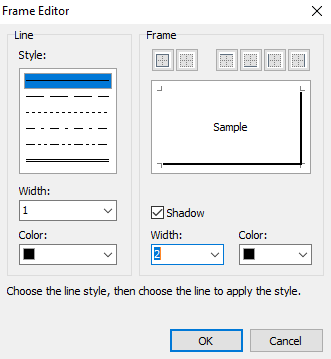
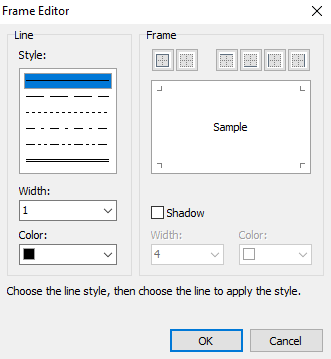
Let’s go back to the map editor and find the frame editor.
Line block: you can select a style from the range offered, set the line width and select the color.
Frame block: there is a frame sample in the center and we can choose where to apply the line style through the sample or using buttons (borders on all sides, no borders or borders on certain sides).
When adding a shadow, we can also specify the width and color.
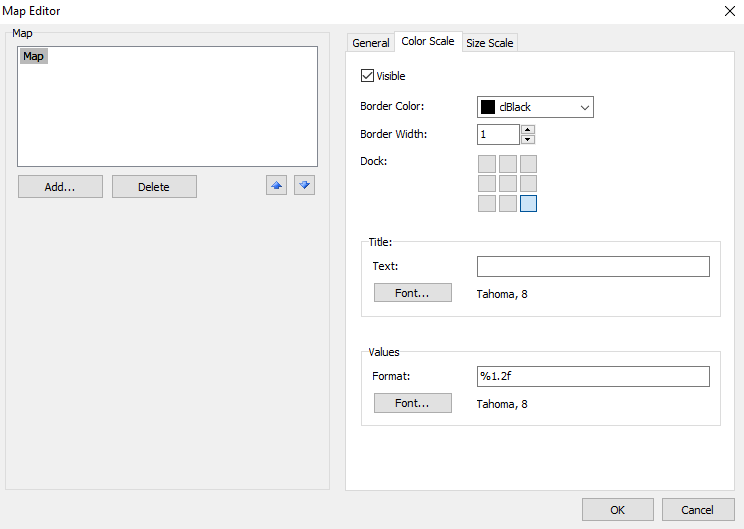
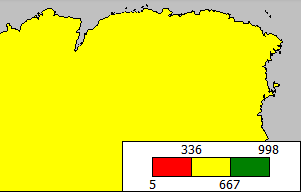 Now let’s consider the second tab of the map editor - the Color Scale.
The frame color can be selected from the ready-made color palette when setting the width of the frames. Set the scale position. In our example, we have the location in the lower right corner.
Enter the name of the scale in the Text field and configure the font and its size by pressing on Font… button.
The Size Scale tab doesn’t differ from the Color Scale so I won’t repeat that.
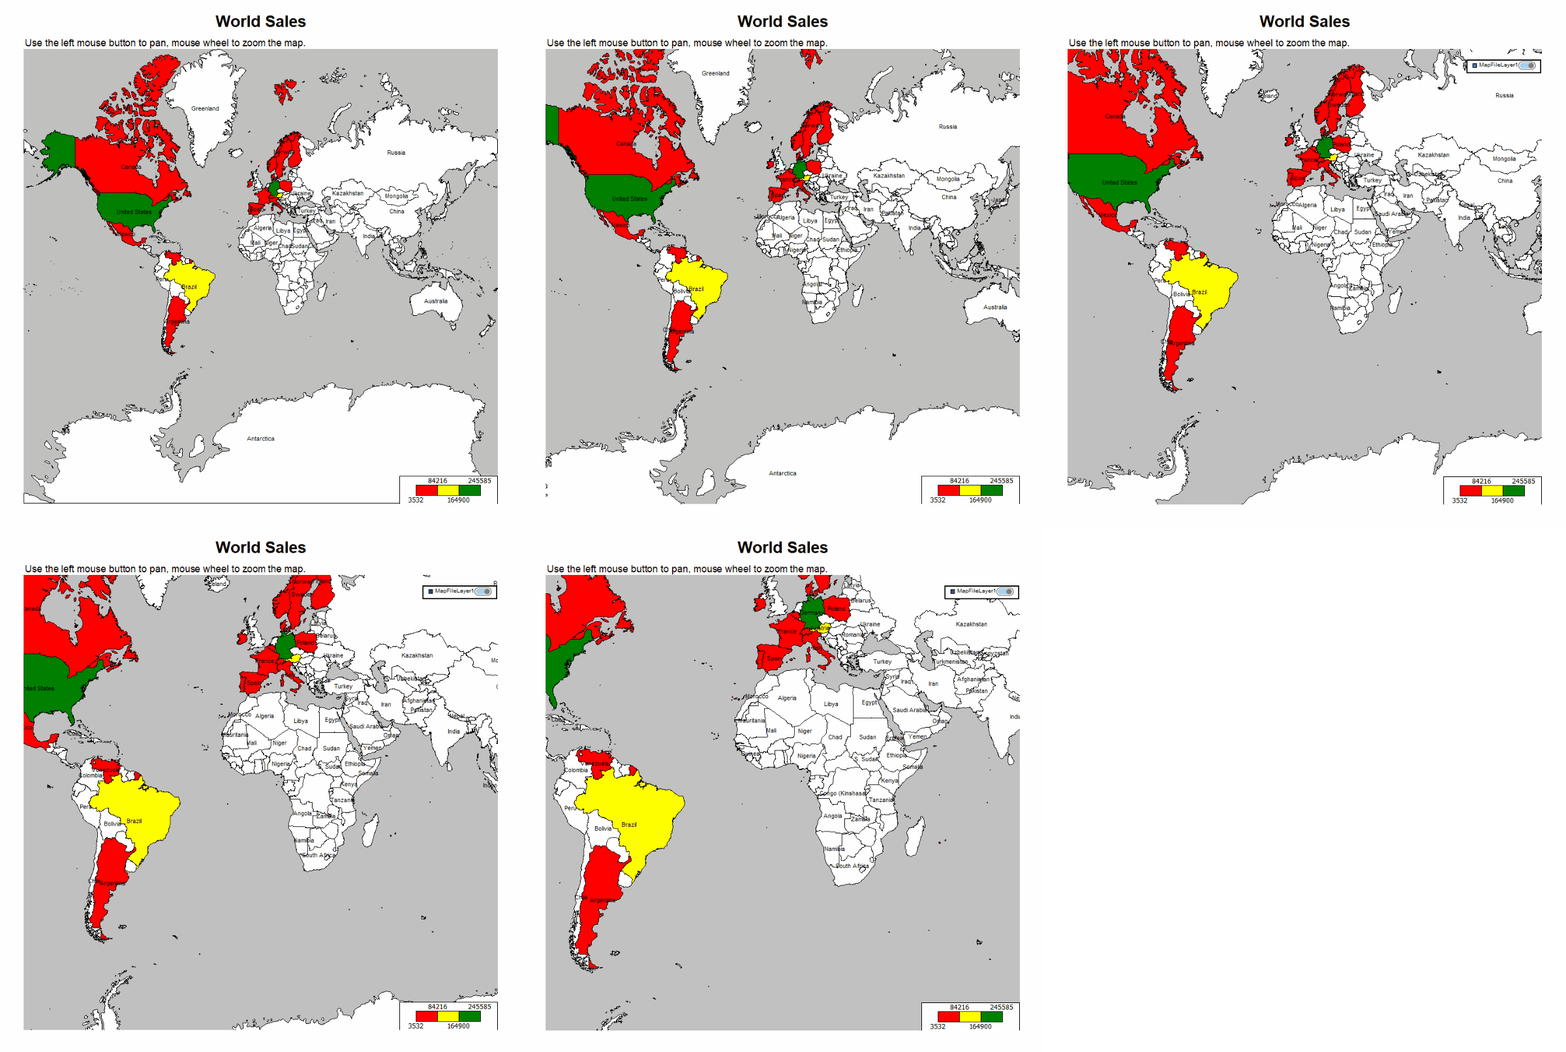
After saving the result, go to the preview tab and see the finished result. Our map will not be static, you can still scale it anywhere and when you hover over a specific area (in our case, any country), this entire fragment will be highlighted.
Creating a SHP map using the code
| Saving in SHP | |
1 2 3 4 5 6 7 8 9 10 11 12 13 14 15 16 17 18 19 20 21 22 23 24 25 26 27 28 29 30 31 32 33 34 35 36 37 38 39 40 41 42 43 44 45 46 47 48 49 50 51 52 53 54 55 56 57 58 59 60 61 62 63 64 65 66 67 68 69 70 71 72 73 74 75 76 77 78 79 80 81 82 83 84 85 86 87 88 89 90 91 92 93 94 95 96 97 98 99 100 101 102 103 104 105 106 107 108 109 110 111 112 113 114 115 116 117 118 119 120 121 122 123 124 125 126 127 128 129 130 131 132 |
procedure TForm1.FormCreate(Sender: TObject); var page: TfrxReportPage; map: TfrxMapView; layer: TfrxMapFileLayer; applayer: TfrxApplicationLayer; begin page := TfrxReportPage(frxReport1.FindObject('Page1')); map := TfrxMapView.Create(page); with map do begin CreateUniqueName(); SetBounds(0, 0, 700, 800); MaxZoom := 50; MinZoom := 1; KeepAspectRatio := True; MercatorProjection := True; with ColorScale do begin Visible := True; BorderColor := 0; BorderWidth := 1; Dock := sdBottomRight; FillColor := 16777215; ValueFormat := '%1.0f'; with Font do begin Charset := 1; Color := -16777208; Height := -13; Name := 'Tahoma'; Style := []; end; with TitleFont do begin Charset := 1; Color := -16777208; Height := -13; Name := 'Tahoma'; Style := []; end; end; with SizeScale do begin Visible := True; BorderColor := 0; BorderWidth := 1; Dock := sdTopLeft; FillColor := 16777215; ValueFormat := '%1.0f'; with Font do begin Charset := 1; Color := -16777208; Height := -13; Name := 'Tahoma'; Style := []; end; with TitleFont do begin Charset := 1; Color := -16777208; Height := -13; Name := 'Tahoma'; Style := []; end; end; end; layer := TfrxMapFileLayer.Create(map); with layer do begin CreateUniqueName(); MapFileName := 'C:\Program Files (x86)\FastReport 6 VCL Enterprise\Demos\Main\Maps\world.shp'; DataSet := MapOrderDetailsDS; LabelColumn := 'NAME'; SpatialColumn := 'NAME'; ZoomPolygon := 'Germany'; LabelKind := mlName; MapPalette := mpNone; MapAccuracy := 0; PixelAccuracy := 0; HighlightColor := 65280; Operation := opSum; ValueFormat := '%1.0f'; PointLabelsVisibleAtZoom := 1; with ColorRanges do begin RangeFactor := rfValue; RangeCount := 0; Visible := True; StartColor := 255; MiddleColor := 65535; EndColor := 32768; end; with SizeRanges do begin RangeFactor := rfValue; {uses frxMapRanges} RangeCount := 0; Visible := True; StartSize := 4; EndSize := 20; end; end; applayer := TfrxApplicationLayer.Create(map); applayer.CreateUniqueName(); with applayer do begin DataSet := MapOrderDetailsDS; AnalyticalValue := '<MapOrderDetails."UnitPrice"> * <MapOrderDetails."Quantity"> * (1 - <MapOrderDetails."Discount">)'; Filter := '<MapOrders."ShipCountry"> = ''Germany'''; HighlightColor := 65280; Operation := opSum; ValueFormat := '%1.0f'; LabelKind := mlName; MapPalette := mpNone; PointLabelsVisibleAtZoom := 1; LabelValue := '<MapOrders."ShipCity">'; LatitudeValue := '<MapOrders."Latitude">'; LongitudeValue := '<MapOrders."Longitude">'; SizeRanges.RangeFactor := rfValue; SizeRanges.RangeCount := 3; SizeRanges.Visible := True; SizeRanges.StartSize := 8; SizeRanges.EndSize := 20; ColorRanges.RangeFactor := rfValue; ColorRanges.RangeCount := 3; ColorRanges.Visible := True; ColorRanges.StartColor := 255; ColorRanges.MiddleColor := 65535; ColorRanges.EndColor := 32768; end; frxReport1.ShowReport; end; |
Shape is far from the only format to work with maps: there are also OpenStreetMap (OSM) and GPS eXchange Format but I will talk about them in other articles.