How to make a simple FastCube .NET cube editor
To view and edit cubes and slices from FastCube .NET, you need a special application that you need first create. Since FastCube .NET comes in the form of a library and components, we can easily embed the cubes editor into your existing WinForms application, or create a separate one, specially for it.
In this article, we'll look at the way how to create a simple cubes and slices editor in two ways: using controls or from program code.
1) The first way - visual controls
Create a Windows Form Application.
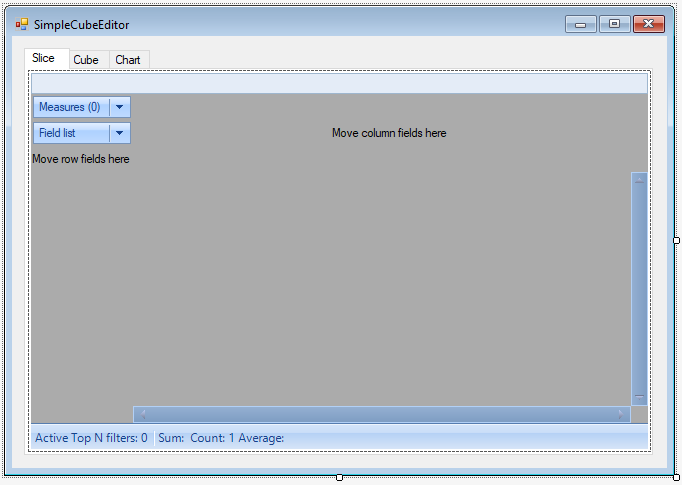
We add a tabControl component with three tabs: Slice, Cube and Chart.
As you could already guess, on the first tab we will display the slice of the OLAP cube, on the second one - the data from the cube, on the third - the diagram on the slice.
It is necessary to connect libraries to the project: FastReport.Olap and FastReport.Bars.
In the Toolbox, we have a set of controls for the FastCube:
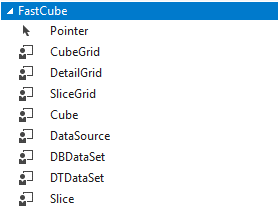
Drag the Cube control to our form. We have 4 types of data source for the cube in the DataSource property:
DataSource - data from the database;
File - data from the cube file;
Stream - data from the stream;
Manual - manual filling.
In our example, we use the cube file containing the data (File Type).
You can download the cube file from the application code. For example, in the OnLoad event:
cube1.Load("C:/Program Files (x86)/FastReports/FastCube.Net Professional/Demos/Data/Cubes/2_0_sample_en1.mdc");
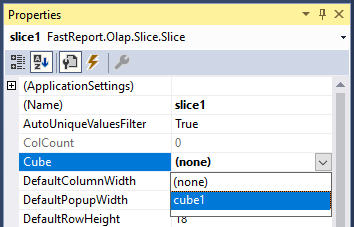
Now add the Slice component to the form. In its properties we only need to choose a cube:
Now, you need to display the cube and slice. On the Slice tab, place the SliceGrid control.
All we need is to set the Slice property for it. Choose the value of slice1.
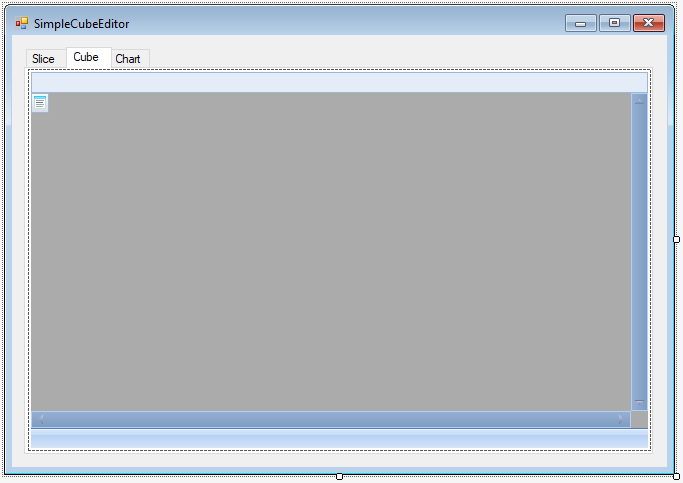
Add the CubeGrid control to the Cube tab. In its Cube property choose cube1.
On the third tab - Chart - we add the Chart control:
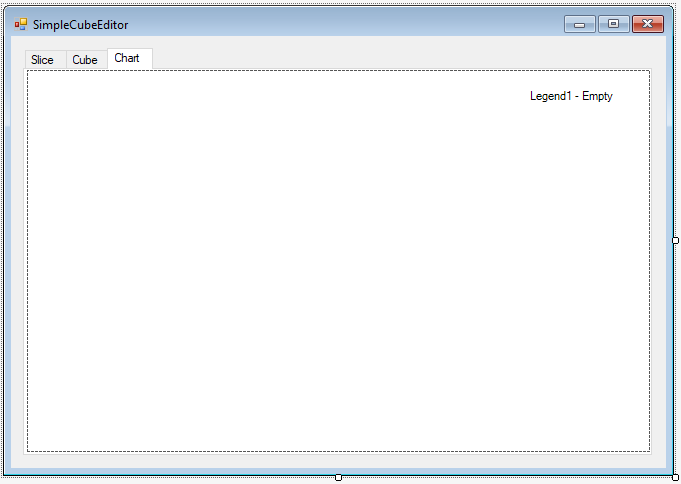
In the properties of the added control, find Slice and select the value of slice1.
If we run the application right now, we'll see the loaded cube, the slice and the diagram, but we will not be able to load another cube, or save the changes in the current one. You need to add toolbars for each component: SliceGrid, CubeGrid, and Chart.
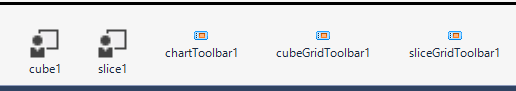
To do this, drag the following components onto the form from the toolbox: SliceGridToolbar, CubeGridToolbar, ChartToolbar.
The components will appear below the form:
In the chartToolbar properties, find Chart and select the value chart1.
For cubeGridToolbar, set the Grid property to cubeGrid1.
In the sliceGridToolbar properties for the Grid field select sliceGrid1.
Now we need to bind these toolbars to the corresponding tabs. Add three lines of code to the load event of the OnLoad form:
sliceGridToolbar1.Parent = tabPage1;
cubeGridToolbar1.Parent = tabPage2;
chartToolbar1.Parent = tabPage3;
Now let’s run the application:
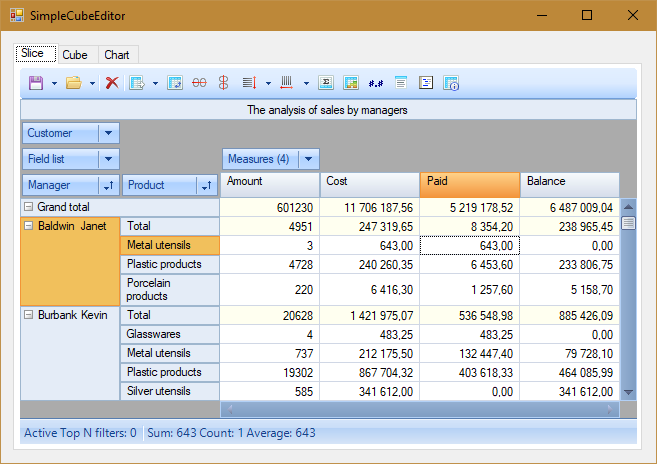
SliceGridToolbar is located at the top. A slice is a sample of data from a cube for specified dimensions and measures.
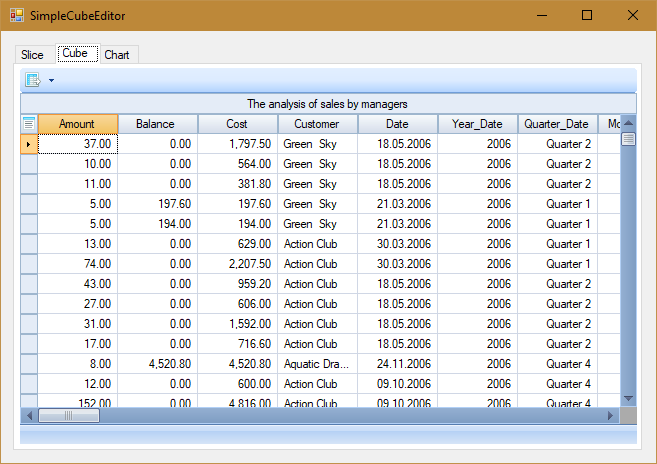
Here all the data from the cube are displayed.
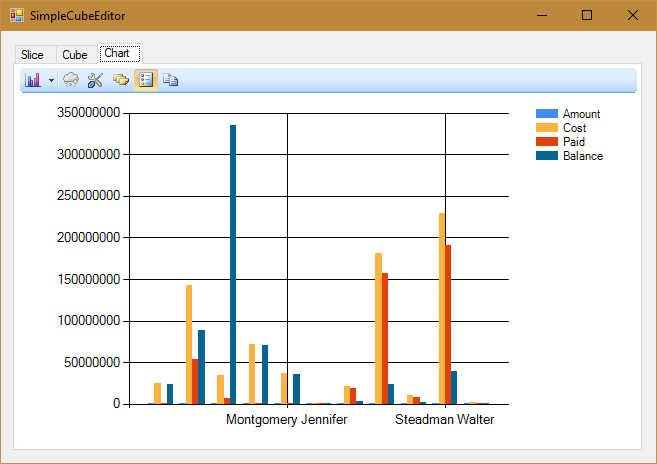
The graph is based on the data from the slice. There is also a toolbar.
2) The second way is in the code of the program
All that we added to the form with the mouse, you can manually write in the application code.
In the reference, add the following libraries: FastReport.Olap, FastReport.Bars, System.Windows.Forms.DataVisualization;
On the form, add a TabControl control with three tabs. Open the form code.
In the using section, we need libraries:
1 2 3 4 |
using System; using System.Windows.Forms; using FastReport.Olap.Controls; using FastReport.Olap.Chart; |
We place all the code for creating and configuring components, for example, in the class constructor:
1 2 3 4 5 6 7 8 9 10 11 12 13 14 15 16 17 18 19 20 21 22 23 24 25 26 27 28 29 30 31 32 33 34 35 36 37 38 39 40 41 42 43 44 45 46 47 48 |
public Form1() { InitializeComponent(); FastReport.Olap.Cube.Cube cube = new FastReport.Olap.Cube.Cube(); FastReport.Olap.Slice.Slice slice1 = new FastReport.Olap.Slice.Slice(); slice1.Cube = cube; SliceGrid sliceGrid = new SliceGrid(); sliceGrid.Dock = DockStyle.Fill; sliceGrid.Parent = tabPage1; sliceGrid.Slice = slice1; SliceGridToolbar sliceGridToolbar = new SliceGridToolbar(); sliceGridToolbar.Dock = DockStyle.Top; sliceGridToolbar.Parent = tabPage1; sliceGridToolbar.Grid = sliceGrid; CubeGrid cubeGrid = new CubeGrid(); cubeGrid.Dock = DockStyle.Fill; cubeGrid.Parent = tabPage2; cubeGrid.Cube = cube; CubeGridToolbar cubeGridToolbar = new CubeGridToolbar(); cubeGridToolbar.Dock = DockStyle.Top; cubeGridToolbar.Parent = tabPage2; cubeGridToolbar.Grid = cubeGrid; Chart chart = new Chart(); chart.Dock = DockStyle.Fill; chart.Parent = tabPage3; chart.Slice = slice1; ChartToolbar chartToolbar = new ChartToolbar(); chartToolbar.Dock = DockStyle.Top; chartToolbar.Parent = tabPage3; chartToolbar.Chart = chart; cube.Load("J:\\Program Files (x86)\\FastReports\\FastCube.Net Professional\\Demos\\Data\\Cubes\\2_0_sample_en1.mdc"); } |
That's all. The application is ready. Drag and drop controls with the mouse, or create them in the code – you choice.