How to use interactive maps in FastReport VCL 6
Interactive maps have become very popular with the appearance of Google Maps. They allow you to navigate the map, zoom in and out, and many other functions. With the release of FastReport VCL 6, such maps can be embedded in reports. To do this, you must obtain a map in one of the two available formats and insert it into the report using the Map object.
You can use maps in .shp and .osm format, and gps tracks in the .gpx format.
The .shp - ShapeFile format. This is a special format for storing vector geoinformation data. It was developed by the American company ESRI in the 1990s. Currently, it is the most commonly used format in Geoinformation systems.
Actually ShapeFile is not a single file. In addition to the .shp file, the set also includes .shx and .dbf.
The first, .shp, is a geometric description of the figures. The .shx file has a positional index to bind the shapes to each other. The .dbf file contains information about the shapes from the .shp file.
Since this is a commercial product, some maps may be chargeable.
The .osm format is OpenStreetMap. This is a geographic data storage format based on xml. From the title it is clear that this is an open project, which is supported exclusively by volunteers. This web project is a global map of the globe. Volunteers are constantly replenishing the map with new geolocation data, aerial photographs. The project has become very popular and has a huge number of participants. Therefore, the details of the maps are at a sufficiently high level. All maps in osm, as in shp, are presented in a two-dimensional format without displaying altitudes above sea level.
Since the project is free, the maps are also free.
First of all we need a map. The Map object supports three file formats: .shp, .osm, .gpx.
The first two represent vector maps, the latter - a set of routes and tracks for maps. You can download the map in one of the available formats, and then, in a new layer of GPS data.
Before considering the Map object, let's determine where to get these maps. You can download ready-made maps on the Internet. A lot of sites provide both paid and free maps in both formats.
There is another way to get the file with the map. It is suitable for osm format. There is a special service - an interactive map of the globe (www.openstreetmap.org). This service allows you to select the desired area and export it to a file. However, there is a limitation on the size of the exported area. Typically, this area is located one settlement, or part of it. Let's see how it looks like:
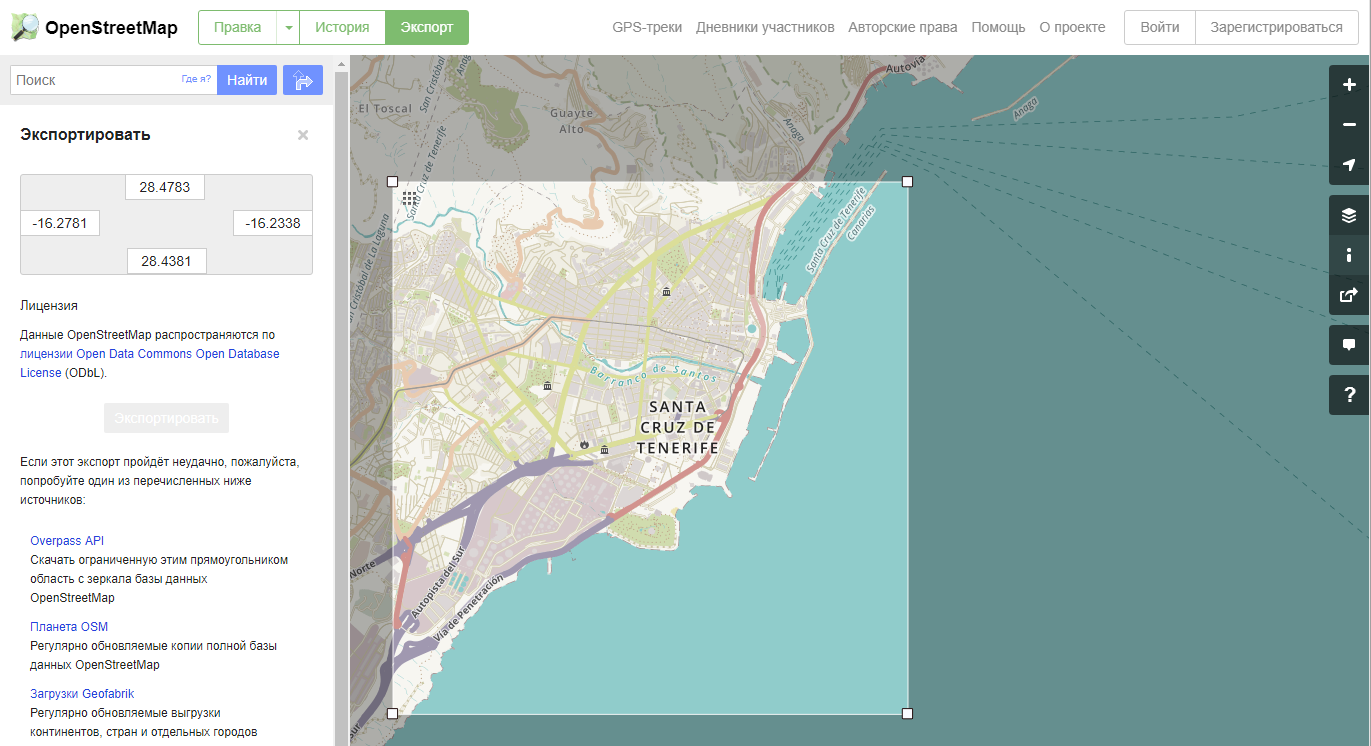
By clicking the "Export" button, the browser downloads the osm file. So, if you need to show a small area on the map, this service will be very helpful.
If you just want to experiment, like me, then you can take the finished files PortoSantoTrack.osm and PortoSantoTrack.gpx from the FastReport VCL 6 delivery.
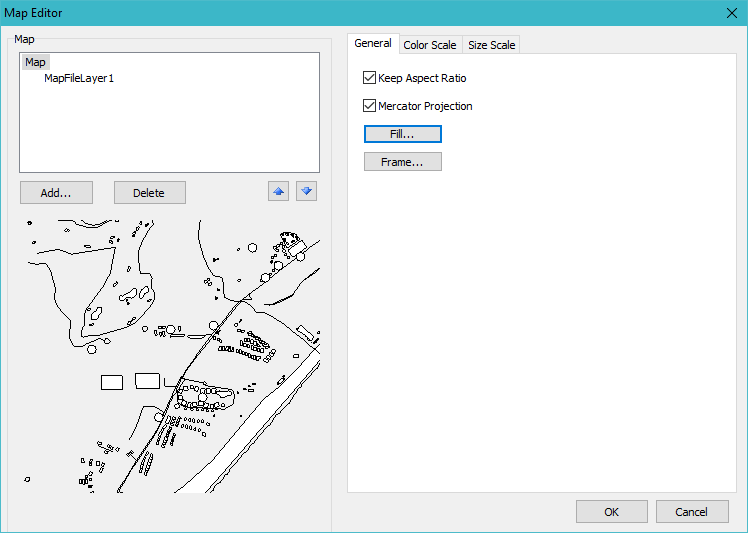
Create a report. And add a Map object to the page. By the way, you can place this object on any band, except for "Data". After adding an object, we will immediately see its editor.
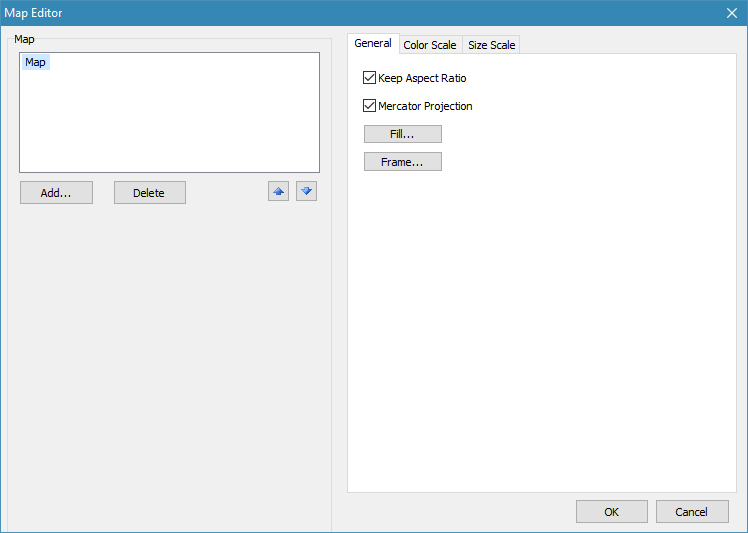
For now, the object is empty. We see only: general settings, color scale, size scale.
The map consists of layers. You can display the entire map in one layer, or divide it into several layers.
In the case of dividing the map into several layers, each layer can be adjusted separately - color, font, line thickness and so on. With the help of different settings for layers, we can, for example, paint the rivers in blue, and the roads in red. Map objects are described by tags in an XML (OSM) file. In each layer, we select the tags (objects) that we need for the display. Then, in the layer settings, set the parameters (color, font, thickness, etc.). So, the layered map allows us to customize the display as desired.
In the case when you display a map in one layer, the settings are applied to all map objects and you can not adjust the display of its individual elements.
Here it is necessary to say that for maps in the .shp format, only one layer is visible.
To add a map, click the Add ... button:
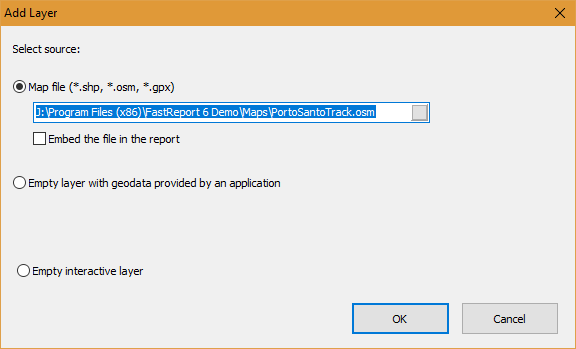
The Add Layer window appears. Choose a file with a map or GPS track. You can include the file in the report with the appropriate option. Below we see two more options for adding a layer:
- an empty layer with data from the application - the data for building a map can be not only in the file, but also in the database. Therefore, create an empty layer and configure the connection to the data source;
- an empty interactive layer - as I understand it, it's not yet implemented functionality. It is possible to create a layer manually using primitives.
Press the OK button. If we load an osm file, we will be offered the window for selecting tags:
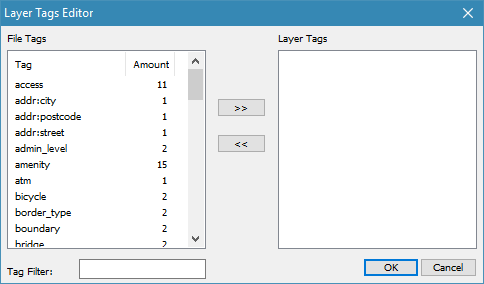
Now, attention! If you click Cancel, all tags for this layer will be automatically selected. But we are going the other way.
Use the arrow button to move the tags to the right side. If we want to display the map in several layers, select the tags that are needed for the current layer. For example, in the first layer, I dragged all the tags except the highway and the waterway:
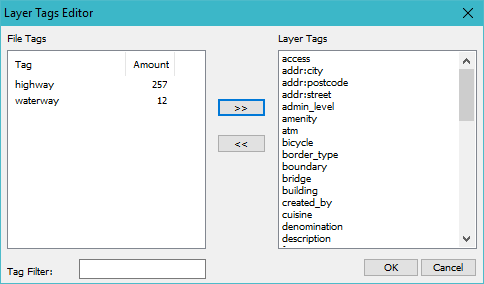
There is a filter for the tags below.
Press the button Ok and get almost the whole map:
In the settings of layer 1 on the Appearance tab, set Point Size to 0 so that they do not interfere:
A few words about the settings of the layer. Settings are presented on five tabs:
- • Data - for the variant of using geodata from the database;
- • Appearance - settings for the appearance of lines;
- • Color Ranges - color palette settings for automatic painting of objects on the map;
- • Size Ranges - settings of the dimension table or dimension grid;
- • Labels - label settings.
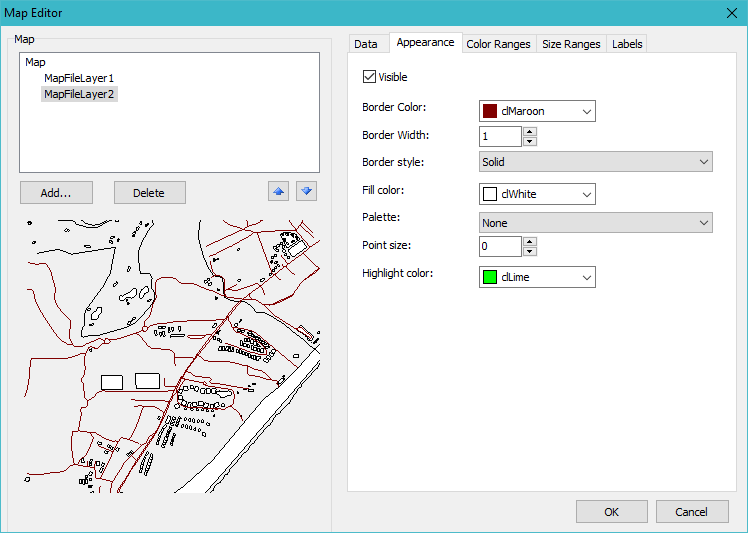
Add one more layer in the same way as before. This time we will select only the highway tag. On the Appearance tab, change the Border Color to Maroon. Now the roads have the maroon color.
Add the third layer. This time, select the waterway tag. Change the Border Color for water objects to blue. And set Border Width to 2.
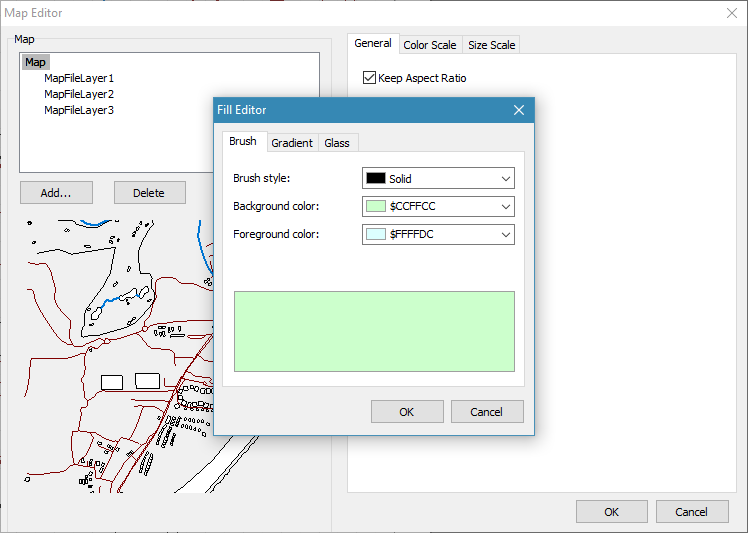
In the Map settings, set the fill. Some pastel color.
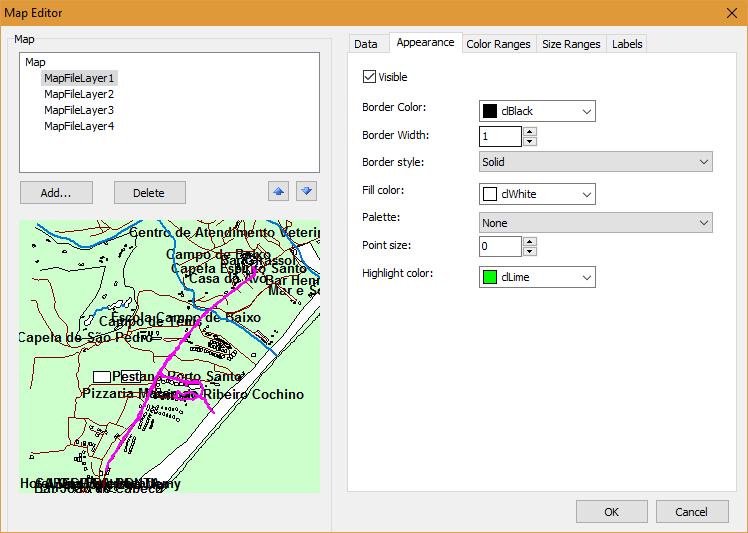
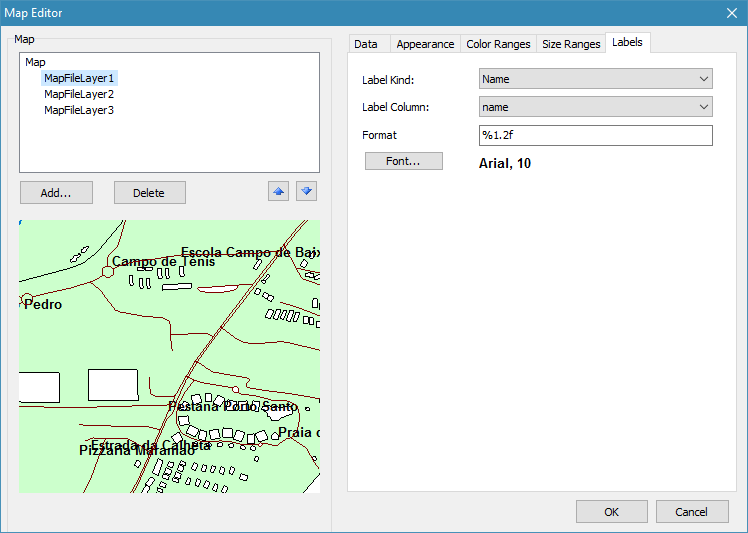
There are not enough labels. Choose the first layer. On the last Label tab, select Label Kind for Name. And for the label column - the name value.
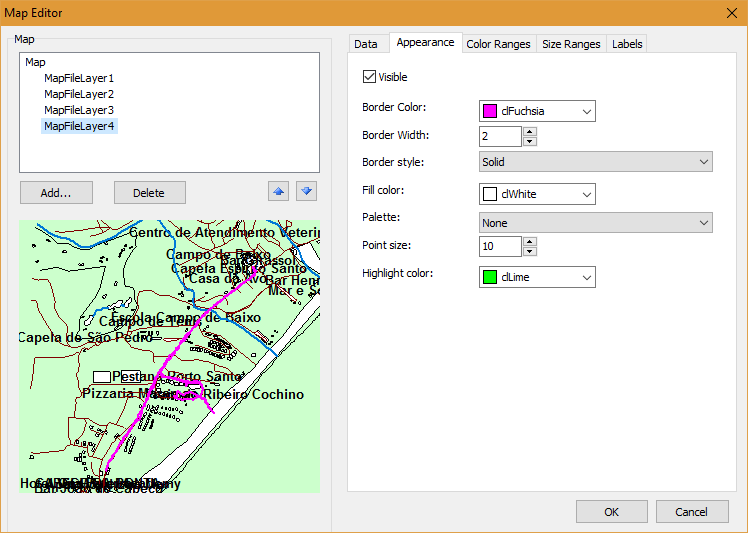
We added the map, let's see now what the gps track looks like for this map. Add one more layer and select the file with the extension .gpx.
On the Appearance tab, select the bright color for Border Color:
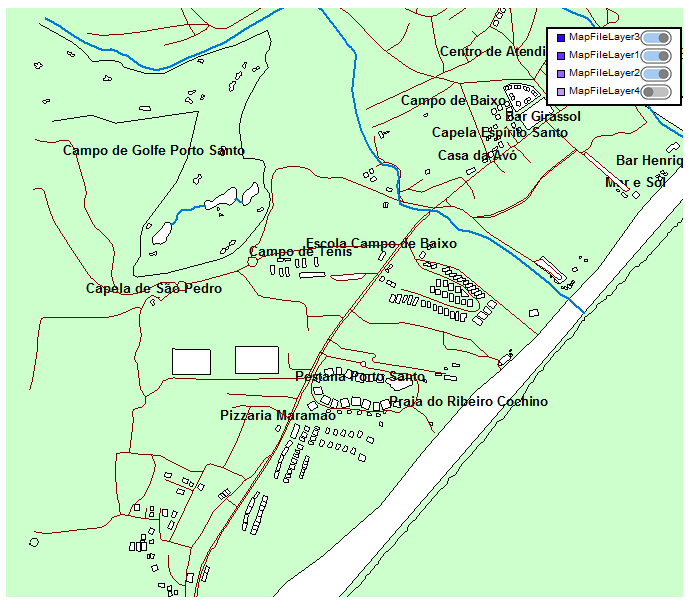
The map is ready. Run the report:
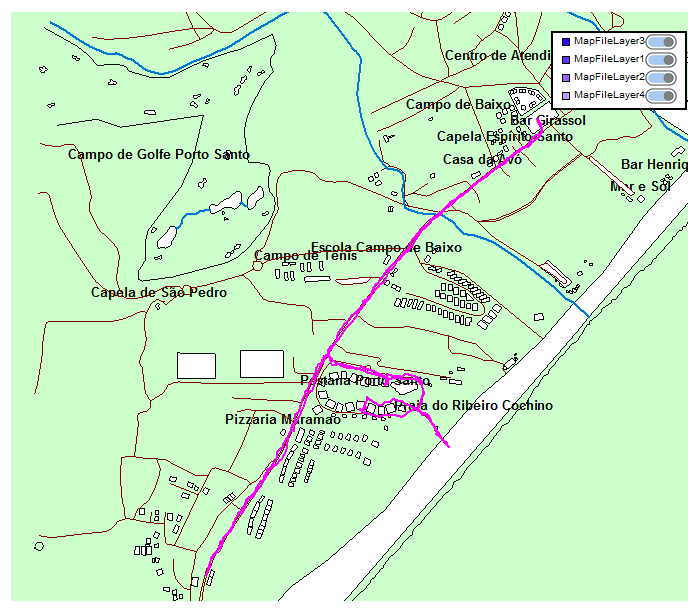
Immediately striking is our gsp track of bright pink color. We can navigate the map with the mouse. You can zoom in and out using the mouse scroll wheel. At the top right is the filtration unit. In it, you can turn off layers if they interfere. For example, disable the last layer - track:
That's all. I agree, there are some difficulties with adding a map by layers. You have to add manually the necessary tags to the layer. But, then, the result is much better than adding all the tags in one layer.