How to make an interactive chart in FastReport VCL 5
In this article we are going to examine one of the latest features of FastReport VCL 5 - interactive diagrams. With the help of them one can display a detailed report for the selected area of a graph.
How it works
First, you create a chart. For example, a circular one:
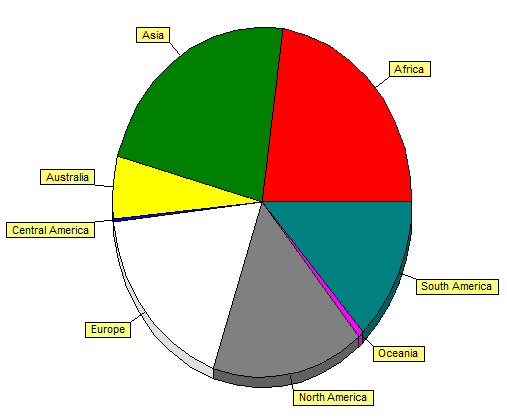
The chart is divided into sections, showing the proportion of parameters of the total mass. When you hover the mouse pointer over one of the sections, it is highlighted with a color.
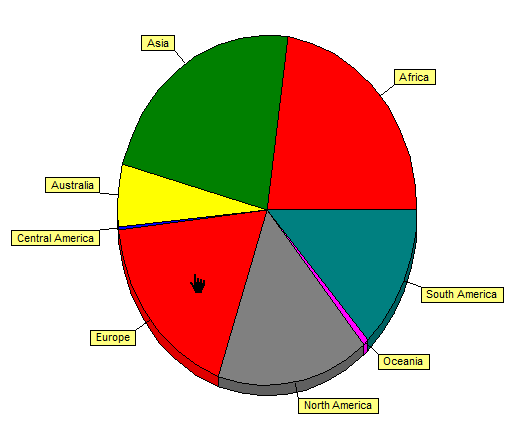
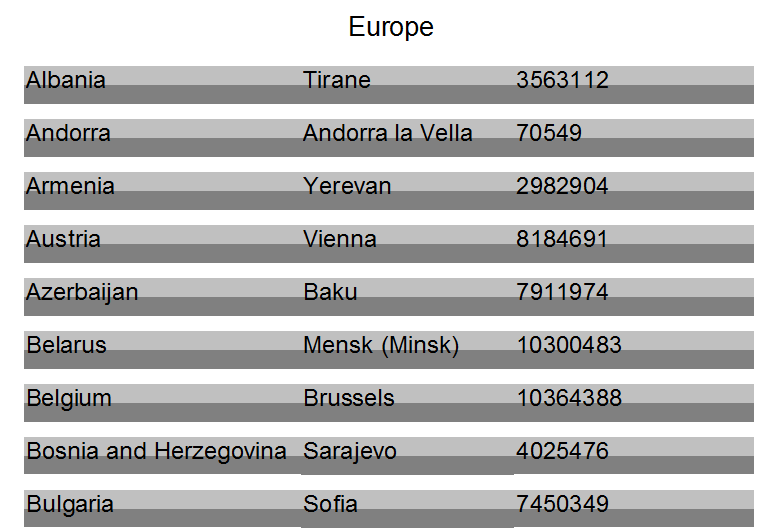
When you right-click on it, a hyperlink to the detail report is triggered. In this case, the value of the parameter (a section name) is transferred to this report. The detail report shows detailed information for the selected section:
How to create it
The implementation of such interactivity is rather simple. You need to create a report with a chart and a detail report. Then, configure a hyperlink from the first report to the second one.
Now create an empty report with any band.
1. First of all, we need some data for the diagram. Therefore, we go to the Data tab. There we add a connection to the ADO Database. Then, we use demo.mdb, a demo database from FR VCL delivery. Next, it is necessary to add the ADO Query component. Double-click on the query editor to open the database. After this, we write the following request:
1 2 3 4 |
SELECT c.Continent, SUM(c.Area) AS Area FROM country c GROUP BY c.Continent |
2. Go back to the report page. Place the Chart object on the band. Double-click on it and open the editor. Add a new series. Let us choose a type of the series - "Horizontal bar".
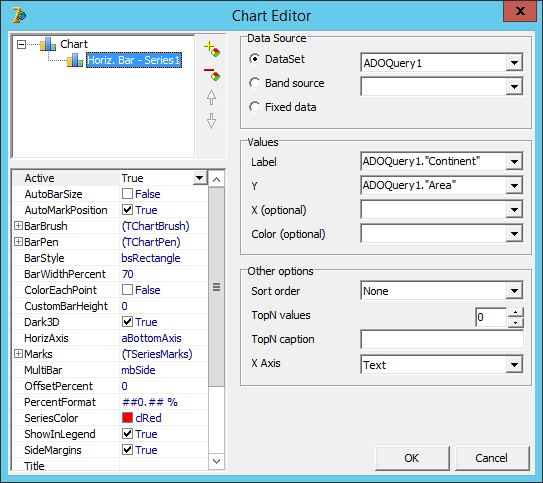
Then we specify the data source. On the Y axis, we display the Area field. In the capacity of the Label, use the Continent field.
3. Now we need to create a detail report.
4. Go to the Data tab. Add a connection to the same database and the ADO Table component. Choose a name of the table - "country".
5. Using a variable editor, add FilterVariable, where we will pass the name of the continent, and where we will filter the table.
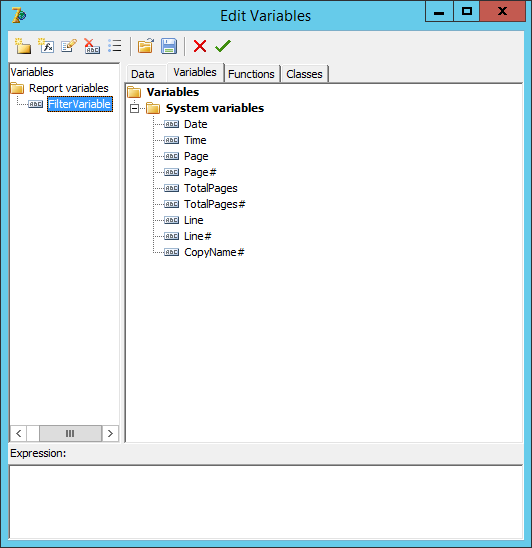
6. Place the variable to the report header. Then put the fields on the MasterData band: Name, Capital and Population:

<ADOTable1. "Continent"> = <FilterVar>
Save the report as "Detail".
8. Go back to the report with the diagram. Click on our diagram. In the property inspector we are interested in a hyperlink. Expand it:
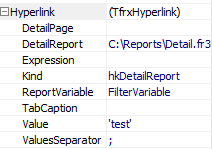
Here it is important to pay attention to the View property. In the drop-down list you can choose one of the following values for it:

For the present example with the interactive diagram, the options are DetailPage and DetailReport. As you understand, you can place a detailed report either on the other page of the current report or in a separate report. Since we chose the second option, the DetailPage property remains empty. For DetailReport we specified the path to the detail report file. This can be either an absolute path or a relative path (relative to the application's working directory).
The Expression property also is not useful for us. You can specify a value for a hyperlink and other types of hyperlinks in it.
Since we transfer the selected value from the chart to the detail report, we specify the variable name in the ReportVariable field.
In the TabCaption property, we can specify the name of the tab, where the drillthrough report opens.
The Value field allows you to set the default values. Then it will be assigned a real value from the diagram.
ValuesSeparator specifies a delimiter if multiple parameter values are passed.
9. To complete the example, just add the OnPreviewClick event handler for the Chart object. We write the following code in it:
1 2 |
if TfrxChartView (Sender) .ClickedVal1 <> '' then TfrxChartView (Sender) .Hyperlink.Value: = '' '' + TfrxChartView (Sender) .ClickedVal1 + '' '' |
From the code it is clear that if any value was selected, it will be written to the Value property.
Now you can run the report and enjoy your work:
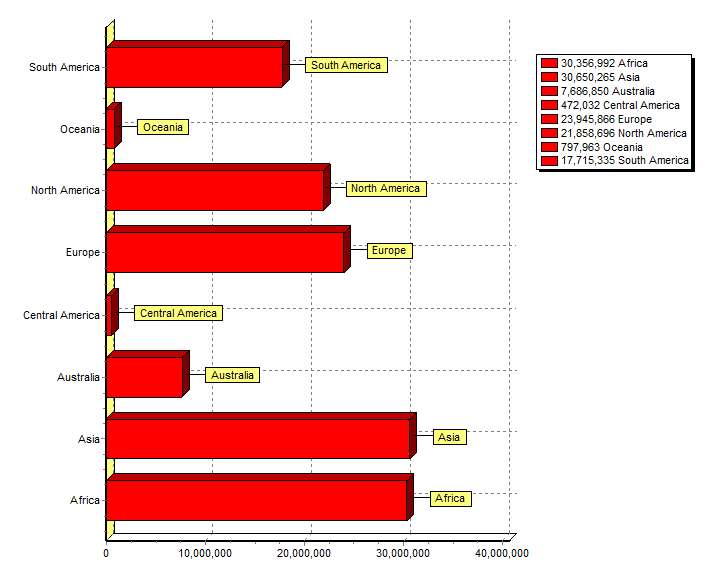
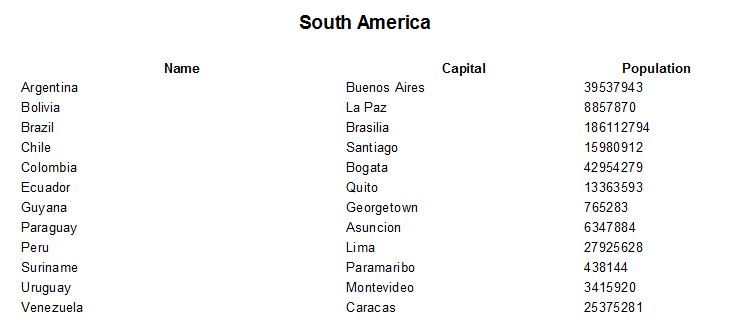
Choose "South America". Then get a detailed report with information of the number of people by country:
If you need to change the color of the selection of the chart element when hovering - use the HighlightColor property of the Chart object.
Summing up, we can conclude that the fifth version of FastReport VCL allows to select individual chart elements and get their meanings. Also, the functionality of hyperlinks has expanded significantly comparing to a single URL. Thanks to these changes, one can easily make reports compact and attractive by hiding detailed information.