How to make columns highlighting, depending on the value of the column
Matrix reports are a great tool for analyzing data. In essence, the matrix in analytical reports is a summary table. "Conditional allocation” is often used to facilitate the analysis. This is a regular tool in FastReport.Net. Conditional highlighting implies highlighting the data cells with color, font, or icons, depending on a given condition. But, conditional highlighting works with individual cells. But what if we want to select entire columns depending on the value in the header? For example, to highlight the weekends. In this case, you will have to resort to the "omnipotent" script of the report, regular color highlighting will not help here.
Create a template with a matrix based on the MatrixDemo table from the nwind.xml demo database:
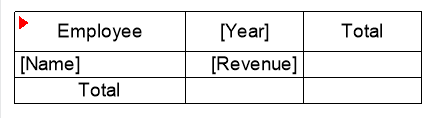
The idea is to find columns with values in the headers that satisfy the condition. In this matrix, we derive the income of employees by year.
Let's make a highlighting of columns with headers 2012 and 2014. To do this, we need to highlight the heading in this column and all subsequent cells, including the total. Create the BeforePrint event for the matrix:
1 2 3 4 5 6 7 8 9 10 11 12 13 14 15 16 17 18 |
// List of selected columns private List<int> markedColumns; // Counter for columns in the first row private int firstLineColumn; // Counter for columns in the following lines private int secondLineColumn; // Matrix event handler private void Matrix2_BeforePrint(object sender, EventArgs e) { // Create a new list for selected columns markedColumns = new List<int>(); // Reset the first row counter firstLineColumn = 0; // Reset the next row count secondLineColumn = 0; } |
In the beginning, we added several variables that we will use in event handlers. These variables store marked columns for rows. Further, before displaying the matrix, we initialize the variables.
Create another handler for the BeforePrint event for the cell with the value of [Year]:
1 2 3 4 5 6 7 8 9 10 11 12 13 14 15 16 |
// Event handler for cells in the first row of the matrix private void Cell18_BeforePrint(object sender, EventArgs e) { // Use sender as TableCell TableCell cell = sender as TableCell; // Check the required value in the cell if (cell.Text == "2012" || cell.Text == "2014") { // Sets the fill color for this cell. cell.FillColor = Color.Brown; // Save to selected list of columns markedColumns.Add(firstLineColumn); } // Increase column count for first row firstLineColumn++; } |
Here I need to make a small remark so that you understand the essence of what is happening. The point is that the matrix output when building a report in FastReport is done line by line. Therefore, we save the column numbers for the first row of the matrix. In our case 2 values will fall into the list of marked columns.
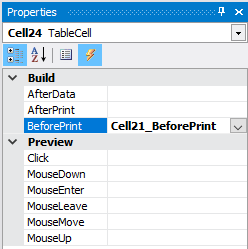
Now add an event handler for the cell with the value [Revenue]:
1 2 3 4 5 6 7 8 9 10 11 12 13 14 15 16 |
// The event handler for the cells in the following rows of the matrix. You need to set it for the second row and the totals. private void Cell21_BeforePrint(object sender, EventArgs e) { // Use sender as TableCell TableCell cell = sender as TableCell; // Find the current index in the markedColumns list if (markedColumns.IndexOf(secondLineColumn) != -1) { // Sets the fill color for this cell. cell.FillColor = Color.Red; } // Increase counter secondLineColumn++; // Reset counter for next row if (secondLineColumn >= firstLineColumn) secondLineColumn = 0; |
In this handler, we find the columns corresponding to the selected columns from the first row and paint their cells in red. Upon reaching the last column, reset the variable for the next line. As you understand, when building a report, the second row of the matrix is dynamic. This means that it will be displayed for each row of data in the source. Therefore, we need to check each row and color the cells in the correct columns.
The solution given in the script is unusual, but the only possible one for this situation, because the matrix is built dynamically and does not store the final structure, coordinates and positions of the cells until it is directly drawn on the sheet. Only the template (the one we see in the designer) and the text values of the matrix headers are stored in memory.
Therefore, we have to go through all the rows and memorize the columns for coloring.
According to the script, we had to create three event handler BeforePrint for the matrix, the cell [Year] and the cell [Revenue]. But, in our matrix there is another, third row. It displays the results, and it would be good to paint them as well according to the selected columns. To do this, for the cell located under [Revenue], simply hook the BeforeFrint event handler from the same [Revenue]:
And now, run the report:
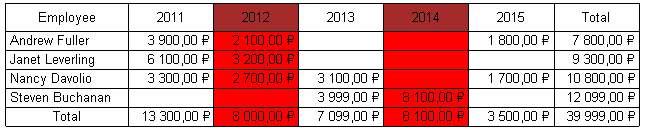
If you want to paint the totals in a different color, you will have to create your own BeforePrint event handler for the cell of the totals, similar to the handler for the [Revenue] cell.