How to generate a chart for groups in FastReport VCL 6
In the article "How to display the totals in a group header in FastReport VCL 6" we examined how to use the Processing property for the "Text" object. However, this property is also typical for the other objects: Chart, Gauge and Barcode. Today, we'll look at applying the Processing property in the context of a Chart object. Using the Processing property, we can use the data that will be retrieved later. This mechanism is called "deferred processing". The idea is that an object with the Processing property turned on is not processed in the order of priority, as usual. It will be processed when the event selected in the ProcessAt property for this object is triggered. Thus, we can, for example, create a chart at the beginning of the report, according to the data obtained at the end of the report.
But in this article we will look at a demo of "Expressions processing" from delivery FastReport VCL 6. Our goal is to display a graph of population for countries, grouped by continent.
Let's create a new report. Add a data source on the Data tab. Create a connection to the database. To do this, drag the ADO Database component from the toolbar and create the connection:
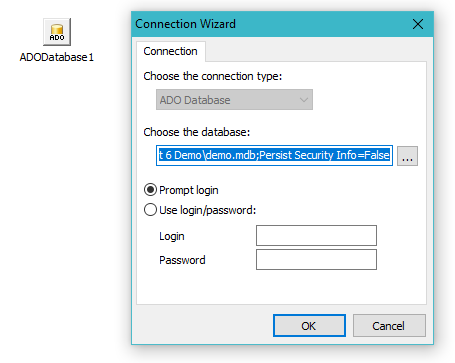
The delivery FR VCL 6 has the demo database demo.mdb. We use it. Now you need to get data from the database. We have a choice between two components: ADO Table and ADO Query. The first one allows you to select a table to display, the second one is to write a sql query. Since the data is not sorted, we will have to write our query with sorting. Drag the ADO Query component into the workspace. In the property inspector of the added object, we find SQL. Double-click on the field next to open the SQL query editor:
1 2 3 |
SELECT * FROM Country ORDER BY Continent, Name |
Go to the report page. On the "Data" band we place the fields:
Name, Area, Population.
We add the "Group header" band. The grouping conditions are the Continent field. Also, add the basement of the group. This pattern was as follows:
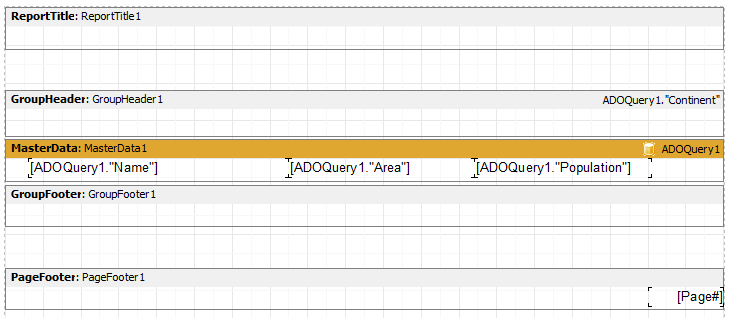
In the group footer we will form the total:
1 |
[SUM(<ADOQuery1."Population">,MasterData1)]
|
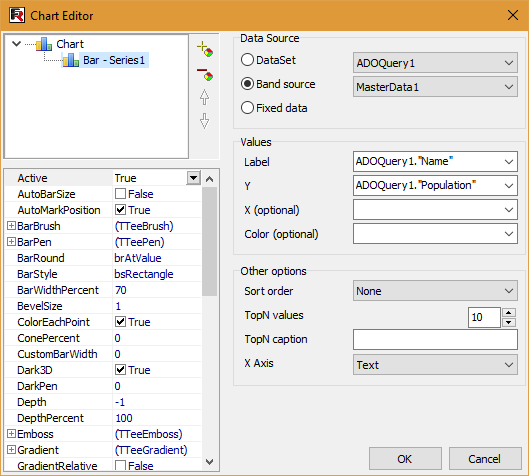
Now add the Chart object to the "Group Header" band. Call the editor of the graph with a double click on it. Add a new series - Bar - Normal. In the series settings, select the data source - Band source - MasterData1. For the Label - value Name, and for the Y axis - Population.
Since there can be a lot of countries on the continent, we do not have the ability to derive everything. Therefore, we restrict ourselves to 10 values. To do this, set the TopN parameter to 10. The final touch is the colored columns. On the left you see the property inspector for the series. Enable the ColorEachPoint property.
Close the chart editor.
Now just select the Chart object by clicking on it. In the Property inspector on the left you will find the Processing. Expand this property and see two more: GroupLevel and ProcessAt. The first one does not interest us, it is intended for groupings with several nesting levels. The second one specifies the event by the object, which will be processed. We choose paGroupFinished for it. This means that our graph will receive data only after the group is displayed. And so for each group. Let's take a look at the final report template:
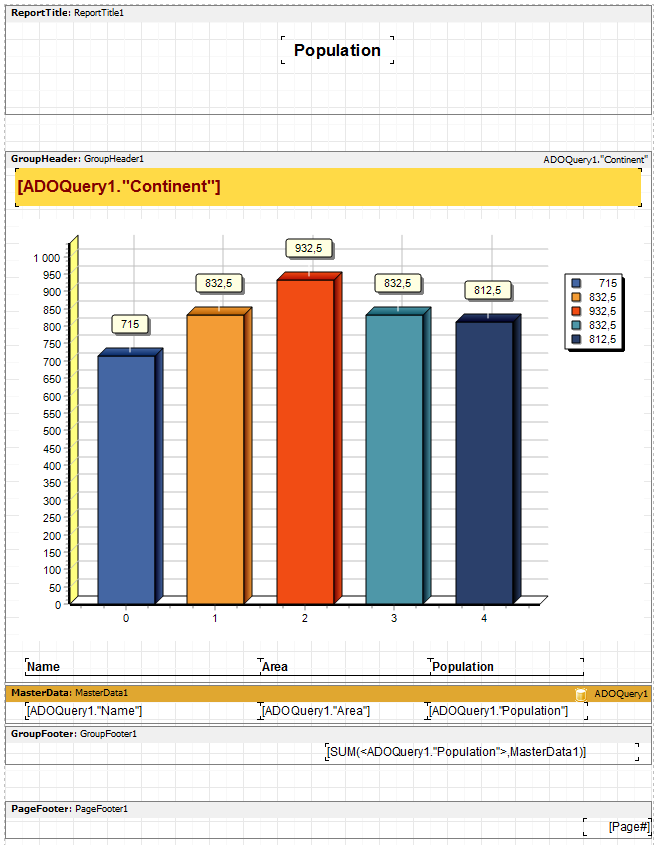
As you have noticed, I added the Continent field and the column headings at the bottom to the "Group Header" band. Well. Let’s run the report:
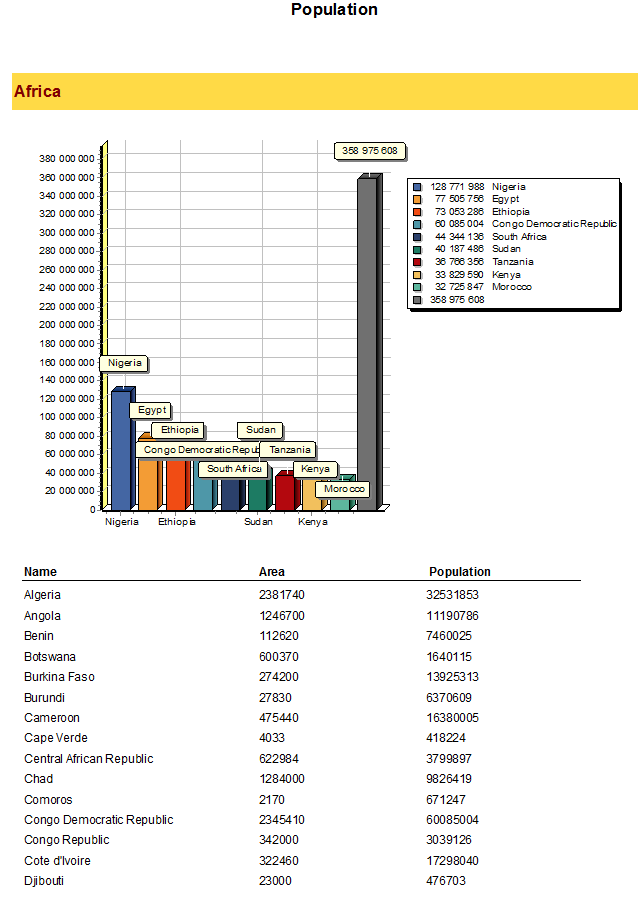
The first group in alphabetical order is Africa. The graph shows 9 columns for countries sorted by descending population. The far right column shows the total count of people in the remaining countries that are not on the diagram. If you want to display only charts, set the Visible property to “false” for the bands MasterData and "Group Cell":
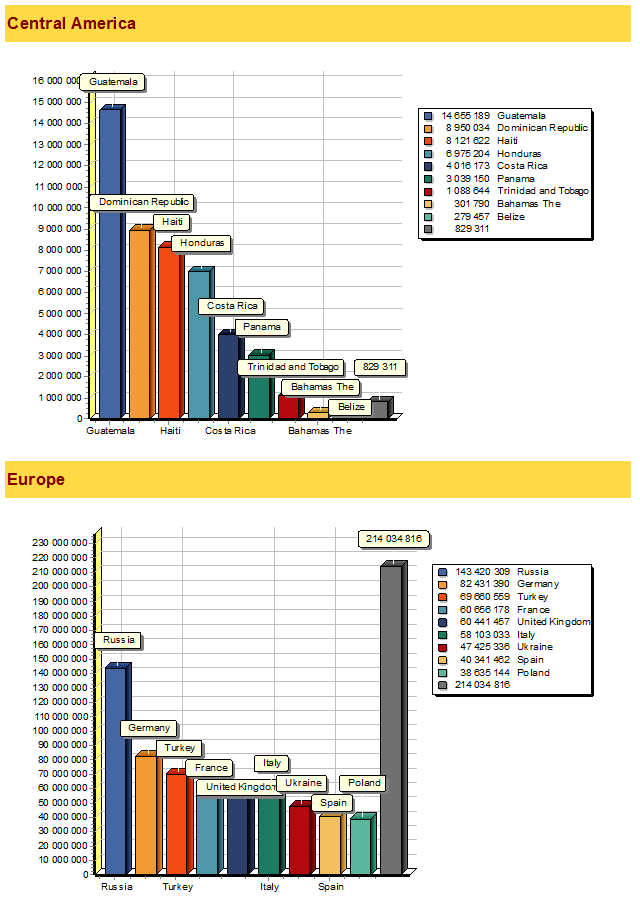
Due to the Processing property, the data grouping can be visually displayed on the chart.