FastReport .NET bands
A report page in FastReport.Net must contain at least one band - a container for objects. But for one it might seem too complicated. Why don't we place objects directly on pages without additional containers? However, it is rather difficult to imagine how the system would work without using any bands. The containers are clearly divided according to their functionality and display order. Headings will always be at the top, data - in the middle, and the totals - at the bottom. We can rearrange the data anyhow in a band and this does not require creating special tables. In order to learn how to work in FastReport.Net, you need to study the bands. This is the fundamentals.
So, in this article, we will consider what bands are presented in FR.Net. We will study their purpose, the order of output in the construction and their behavior.
Here is a list of all available bands:
- Report title - is displayed once at the very beginning of a report, but it is possible to output it after the Page Title;
- Report footer - is displayed at the very end of a report, but before the foot of a page;
- The title of the page - is displayed at the beginning of each page;
- Page footer - is displayed at the end of each page;
- The title of the column - is displayed at the top of each column;
- Cellar column - is displayed at the end of each column;
- Data - is the most important band as it "knows" how to display all the data from the source. It means that it is displayed for each line of data in the source, which it is connected to. The "Data" band is displayed after all the header bands;
- Data header - is displayed once before the "Data" band, which it is attached to (there may be many "Data" bands and you can add header data for each);
- Data cellar - is displayed once immediately after the "Data" band, which it is attached to;
- Group header - appears after a page header or a column header, but before the "Data" band;
- Group cellar - is displayed after the "Data" band;
- A child - can be created for any band. It inherits the type of the parent band;
- Background - just a background for each page of the report.
Let us take a close look at how the bands are built in the designer on the report page:
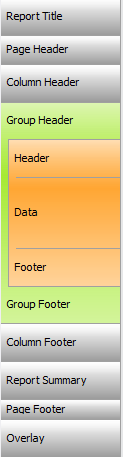
In the given picture the report page looks like a layered pie. The data is output approximately in the middle of it. However, this is just a template. In a constructed report everything looks differently because many bands are displayed several times. It is essential to understand the order of them, that is, which band will be displayed next. In this case, there will be no questions when creating a report.
With header bands everything is more or less clear. They are intended for displaying report headers and column headings of tables:
The footer bands are used to output the total sum according to data, a number of lines or a page number.
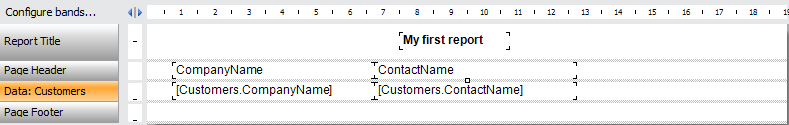
The most interesting band is the "Data" band. As it was mentioned earlier, it connects to the data source:
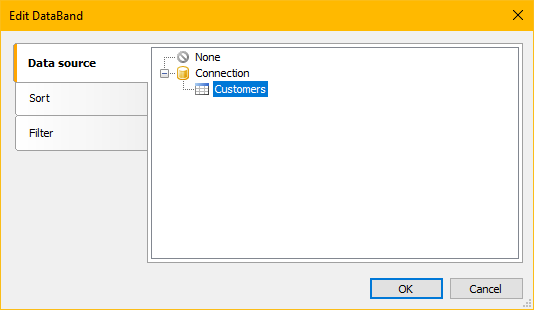
It only displays data from the selected table. If you need to display data from several tables, you will have to create other "Data" bands. The given image shows that in addition to selecting the data source, sorting and filtering are available too. This is very convenient, and it eliminates the necessity to sort and filter the data when creating the source. In addition, the filtering condition can contain a parameter, the value of which we will pass from the dialog form or through the URL (for web reports).
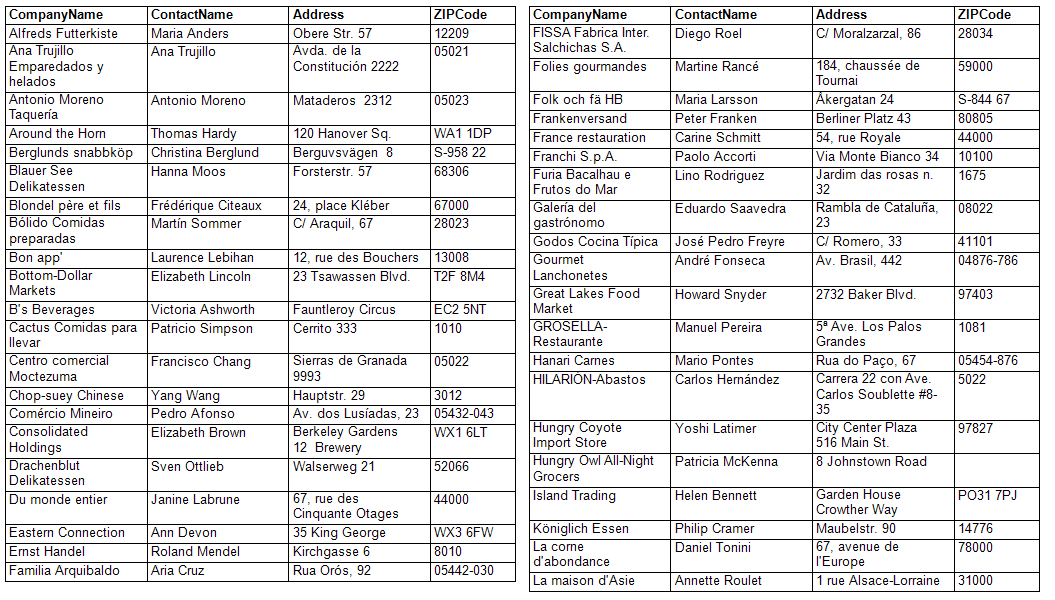
Now let us overview a usage of container-bands. We can print data from the table the following way:
Or this way:
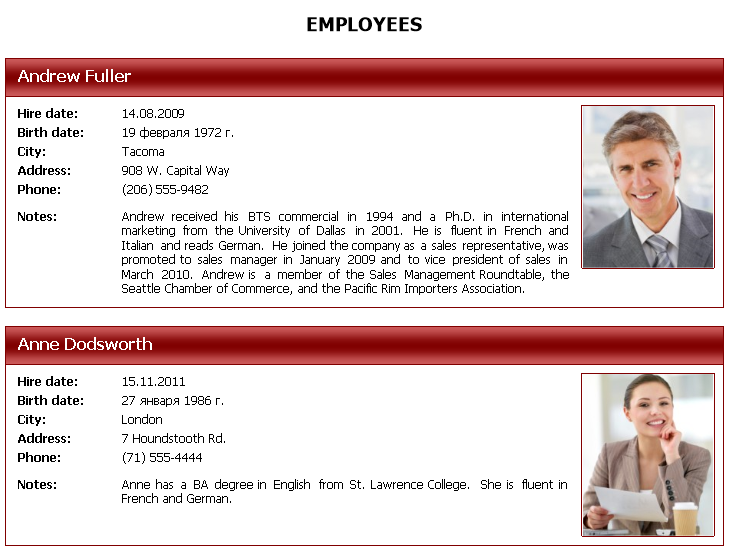
In the first example, we have displayed a traditional list, whereas in the second one - we have compiled the fields into the employee's card. In both cases, it is just one data line. The band allows to place objects within itself freely.
Let us consider the following simple list with date:
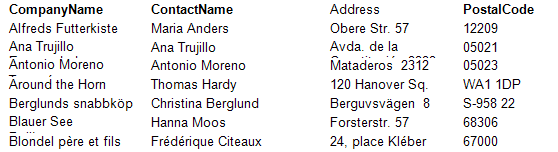
As you can see, some of the data has been transferred to the other line, but the next line is displayed at the top. You can set the band property "Can grow" for the band:
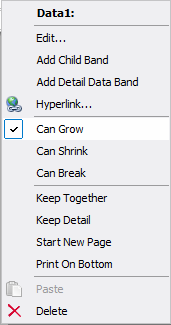
The same property is enabled for text objects, whose data is not displayed completely:
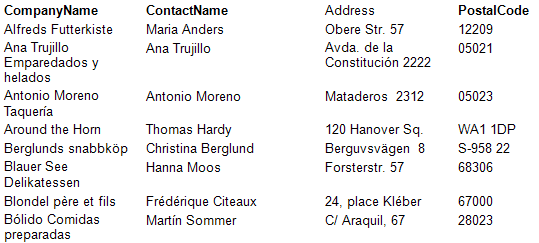
Now the data is fully output. The band itself chooses the height, depending on the size of the objects, located inside.
Objects have many other properties, which are responsible for displaying.
In the context of the "Data" band I would like to talk about the "Child" band. Usually the "Chld" band is used in conjunction with the "Data" band. This link is used for reports like "Master - Detail". In his case, the associated tables are used:
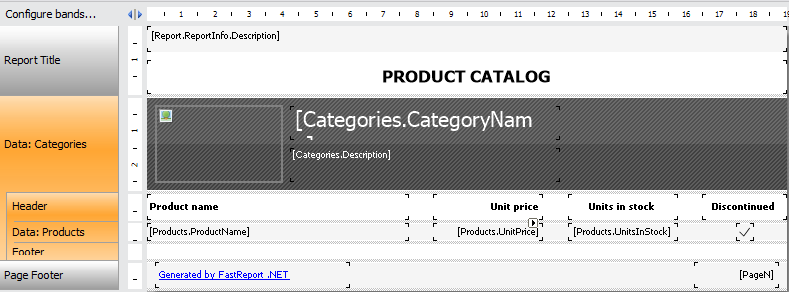
As it is seen in the picture, the main "Data" band has a subordinate "Data" band. Thus, the subordinate "Data" band is displayed every time after the main one. For each entry in the Categories table, the records of the Products table, corresponding to the key field, are displayed.
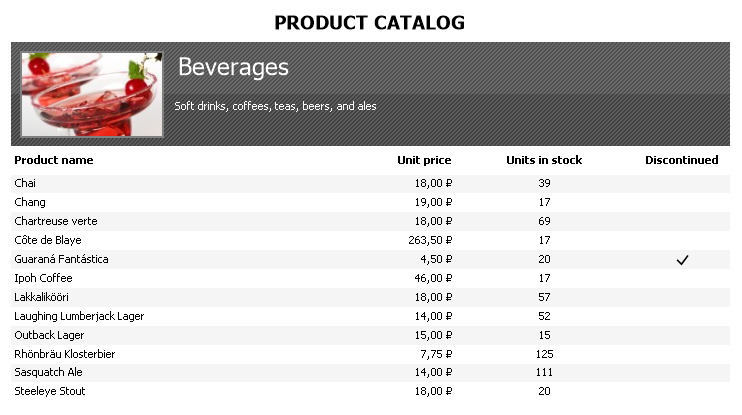
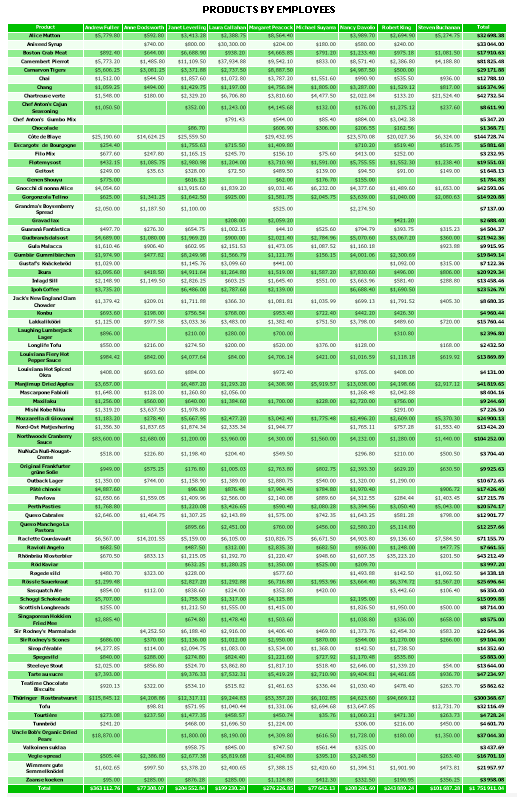
This is how it looks when displaying:
If you display the Products table not in the subordinate "Data" band, but in a separate one, you get the following picture:
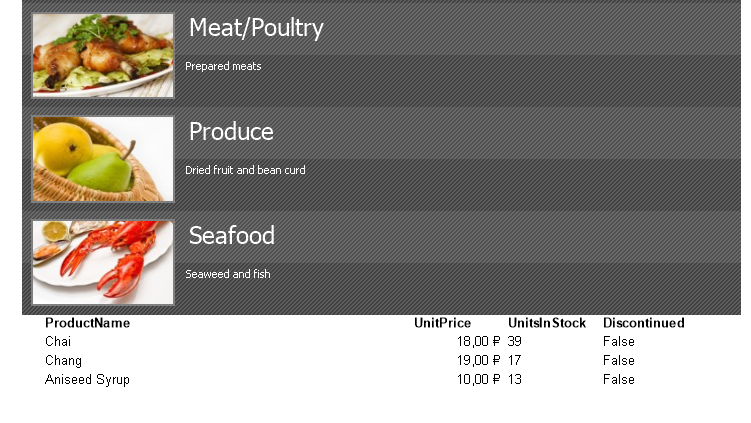
First, all the bands of the Categories table will be displayed, and after, all the bands of the Products table will be displayed too.
Now a few words about the columns. The "Data" band can be set to display data on the columns. In this case, the "Column header" band and the "Column footer" band will be used.
For example, let us set a number of columns "2" in the properties of the report page:
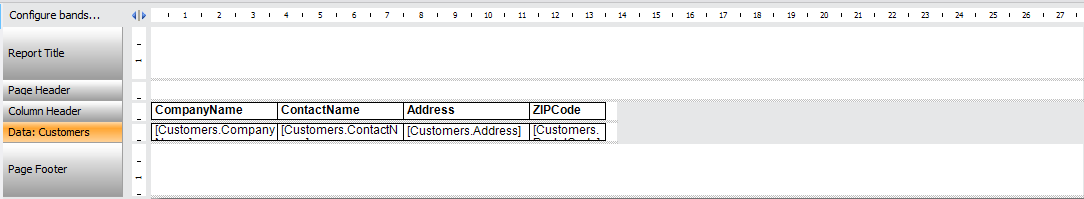
Here is the result:
The number of columns is unlimited.
The report page has 2 more interesting properties: "Unlimited Width" and " Unlimited Height" of a report. Infinite width is relevant for growing breadths of matrixes. The matrixes can increase their height. So, we include both of these properties and get a giant matrix:
To see the data, you have to print it on a plotter. It appears, that the properties have been created exactly for plotter printing or printing in a large format.
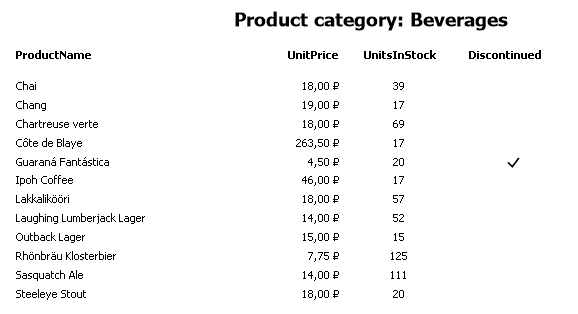
Let us examine the "Group header" band and the "Group footer" band. Usually they are used in pair. When you add the "Group header" bands, the basement is automatically added, and the "Data" band is located between them.
As you understand from the name of bands, they form groups. To group the data, it is necessary to set the condition:
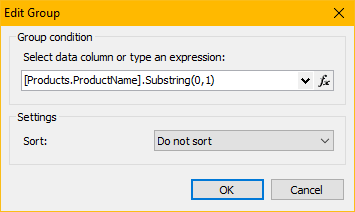
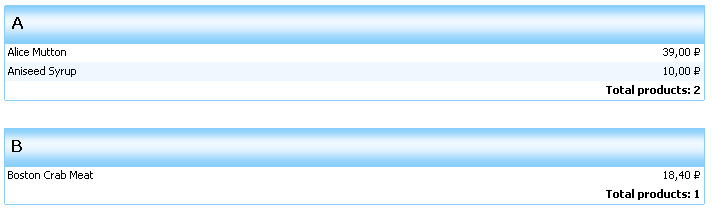
In this case, the process of grouping will be conducted according to the first letter of the product name. A group cellar may contain a sum total for the data or the amount:
The "background" band is used to display a background image, filling or a gradient. It is displayed on each page of your report. However, it is possible to configure the pages, for which it should be displayed:
The height of the part of a page, which is to to be painted, is adjusted by stretching the band.
In this article we have examined the main aspects of the useges of the bands in FastReport.Net.