How to create a sales receipt from a Delphi application
The Delphi programming language, or Turbo Pascal, has become a starting point for many developers. Thanks to the simple and clear syntax and the ability to write in a procedural style, it turned out to be very easy to learn. Many would compare it with Visual Basic, but at the peak of its popularity Delphi gave much more opportunity thanks to the components for the work with databases and its own database – Interbase.
Despite the fact that C # and the .Net platform replaced Delphi and VCL, there is still a large number of their adherents. Even old applications written in this language can be easily upgraded using modern libraries, for example, the FastReport 6 VCL report generator. For instance, automated accounting systems need reporting.
An automated sales accounting system should allow the formation of payment documents, such as a sales receipt. In this article, we will look at how to create and print a sales receipt from a Delphi application. We will use the FastReport VCL report generator to create the receipt itself and a user application to print it. In addition to printing, you can simply display your receipt in the report viewing window, from which you can either print the receipt, save it in one of popular document formats, send it as e-mail or upload it to cloud storage.
To create a sales receipt, we need the information about: order, customer, seller and order content.
In this example, we will use the demo.mdb database from the FastReport VCL distribution.
To create the application, we will use the Delphi 7 development environment.
Let’s add two buttons to the form: one to run the report designer, another one to display or print the finished report. Add the OpenDialog component to the form, too – this will allow us to select the desired report file to open.
Now let’s move on to creating a data source for the report – sales receipt. As mentioned above, we use the demo.mdb database, or more precisely the tables: Orders, Customers, Items, Parts and Employee. We will use the ADOConnection component to connect to the database and the ADOTable components to obtain data from each table. The Orders table is linked to Customers, Items and Employees tables. Therefore, we need to set up these connections. To do so, add a DataSource component for each ADOTable and in order to make all these tables available in the report, add the frxBDDataSet component for each table.
Thus, to work with one table, we should get three components: ADOTable, DataSource, frxDBDataSet.
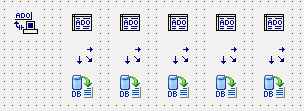
In ADOConnection, create a connection to the demo.mdb database from the FastReport VCL delivery.
These components settings (for each of the five tables) are below.
Orders table:
1. For ADOTable, set the properties:
− Connection – ADOConnection1;
− Name – Orders;
− TableName – orders.
2. For DataSource, set the properties:
− DataSet – Orders.
3. For frxDBDataSet, set the properties:
− DataSet – Orders;
− UserName – Orders.
Customers table:
1. For ADOTable, set the properties:
− Connection – ADOConnection1;
− Name – Customer;
− IndexFieldnames – CustNo;
− MasterSource – DataSource1;
− MasterFields - CustNo
− TableName – customer.
2. For DataSource, set the properties:
− DataSet – Customer.
3. For frxDBDataSet, set the properties:
− DataSet – Customer;
− UserName – Customer.
Items table:
1. For ADOTable, set the properties:
− Connection – ADOConnection1;
− Name – Items;
− IndexFieldnames – OrderNo;
− MasterSource – DataSource1;
− MasterFields - OrderNo
− TableName – items.
2. For DataSource, set the properties:
− DataSet – Items.
3. For frxDBDataSet, set the properties:
− DataSet – items;
− UserName – Items.
Parts table:
1. For ADOTable, set the properties:
− Connection – ADOConnection1;
− Name – Parts;
− TableName – parts.
2. For DataSource, set the properties:
− DataSet – Parts.
3. For frxDBDataSet, set the properties:
− DataSet – Parts;
− UserName – Parts.
Employee table:
1. For ADOTable, set the properties:
− Connection – ADOConnection1;
− Name – Employee;
− IndexFieldnames – EmpNo;
− MasterSource – DataSource1;
− MasterFields - EmpNo
− TableName – employee.
2. For DataSource, set the properties:
− DataSet – Employee.
3. For frxDBDataSet, set the properties:
− DataSet – Employee;
− UserName – Employee.
Customer, Items and Employee tables have a relationship with DataSource1 (the first table – Orders). They are linked by key so that for one record in Orders table the corresponding records from these tables will be selected.
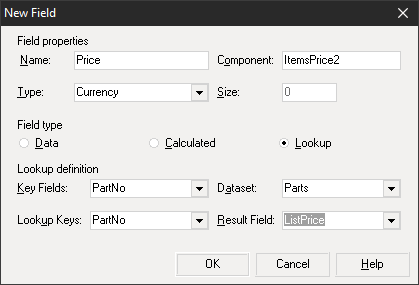
The Items table contains information about the items in the order. There is no specific data about the item – only a link to the Parts table. Let’s add two fields from the Parts table – Price and Description – to the ADOTable for the Items table. Thus, we don’t need to use the Parts table in the future.
To add the computable fields to the Items table, double click on the ADOTable object and see a window with table fields. Initially it is empty but you can load them from the context menu by selecting Add fields …:
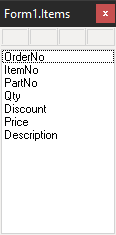
The Price and Description fields will be taken from the Parts table.
Select New field… in the context menu and add the Price field:
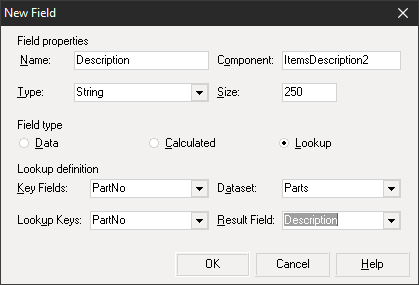
Add a product description (Description field) the same way:
Now, as soon as we’ve created the data source and configured the relationships between the tables, let’s add a couple of buttons to the form. As you may remember, the first button launches the report designer and the second one displays the report.
Do not forget to add frxReport component to the form.
Add a click event for each of the buttons. Here is the event handler code to display the report designer:
1 |
frxReport1.DesignReport();
|
To print the finished report, you can add the Open File dialog box to the form to select the report created in the designer. The code for printing the report will be like this:
1 2 3 4 5 6 7 8 |
OpenDialog1.Filter := 'FastReport VCL (*.fr3)|*.FR3'; OpenDialog1.Execute(); if Length(OpenDialog1.FileName)>0 then begin frxReport1.LoadFromFile(OpenDialog1.FileName); frxReport1.PrepareReport(); frxReport1.Print(); end |
If you need to preview the report, you can replace the Print function with the Report display:
1 |
frxReport1.ShowReport();
|
Now you can run the application, click on the Design report button and proceed to the report creation.
First of all, select report datasets.
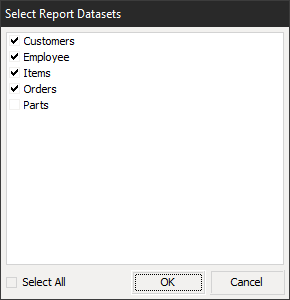
We do not need the Parts table in this report so there is no need to select it. Let’s move on to creating the template. There are two data bands in our report: MasterData and DetailData. In the first data band, we output the information about the client:
- name - Customer.Company;
- address - Customer.Addr1;
- phone - Customer.Phone.
…and the customer:
- company name;
- employee – Employee.FirstName Employee.Last Name;
- order number – Orders.OrderNo;
- sale date – Orders.SaleDate.
This band is linked to the Orders table. The content information of the order will be displayed in a subordinate Data band: product name, quantity, item price, price for specified quantity.
Totals – such as the total Net amount, tax rate, final amount including tax – will be displayed in the footer.
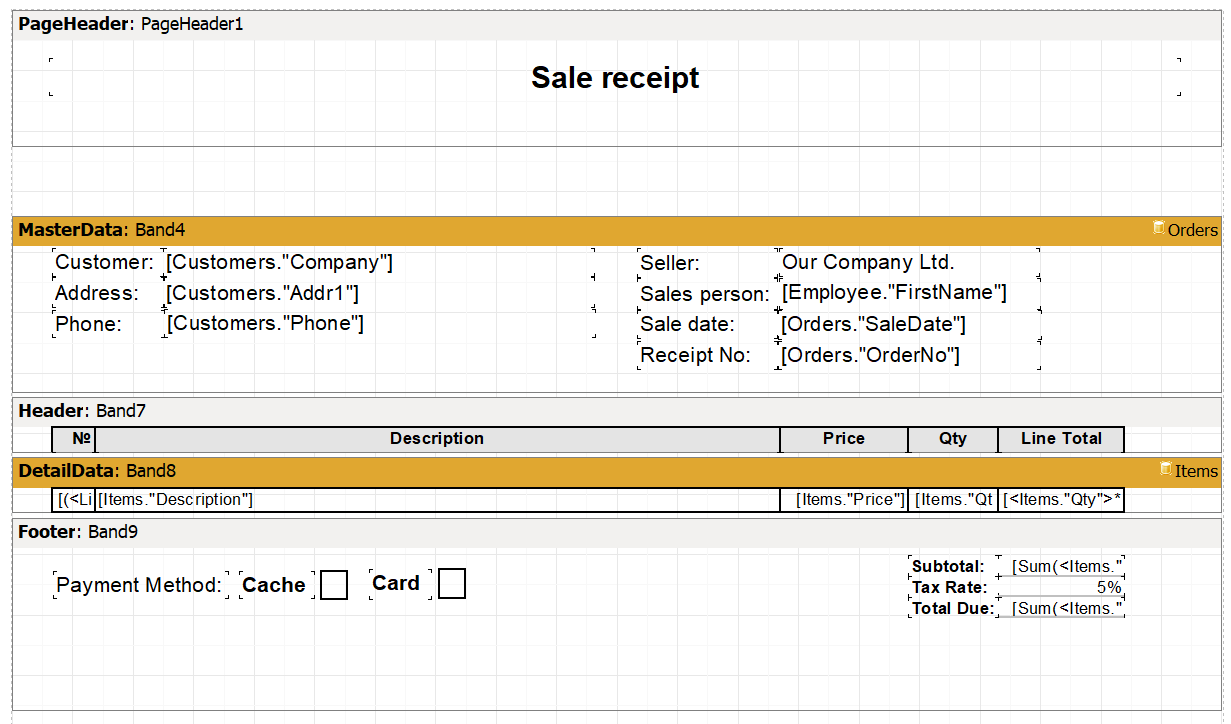
Line Total subtotals are calculated by multiplying the quantity and the item price as part of a single table entry:
[<Items."Qty">*<Items."Price">]
Net subtotals is calculated by the formula:
∑(item quantity * item price)
[SUM(<Items."Qty">*<Items."Price">)]
Total tax value:
∑(item quantity* item price * tax rate)
[SUM(<Items."Qty">*<Items."Price">)*0.05]
Total due:
∑(item quantity * item price)+ ∑( item quantity * item price * tax rate)
[SUM(<Items."Qty">*<Items."Price">) + SUM(<Items."Qty">*<Items."Price">)*0.05]
Also the payment method is reflected in the databand footer. It Is expected that it will be specified when printing a sales receipt manually.
Here we can say that our report is ready for display. Save it to the local storage and close the report designer. Using the second button on the form, select the saved report and print (if you used the print option in the code) or preview it if you chose the report preview option – ShowReport().
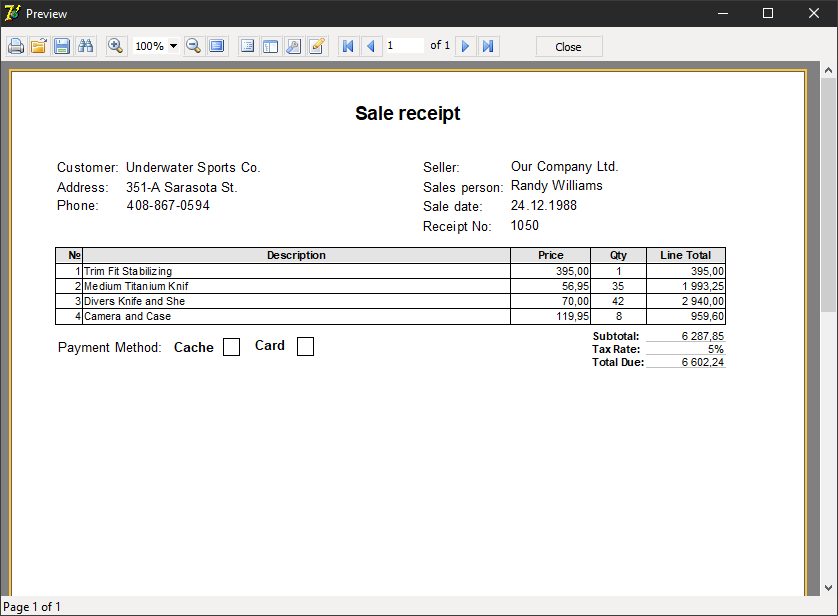
That’s it. With little effort, you can implement useful functionality for your accounting system. Now, from the report viewing window, you can print it or save it in one of the popular document formats: PDF, DOCS, XLSX, XML, RTF and many others.