Release of FastReport Online Designer 2022.1
FastReport Online Designer 2022.1 version cаme up with many new objects and features that will significantly speed up the process of creating and optimizing your reports.
New objects
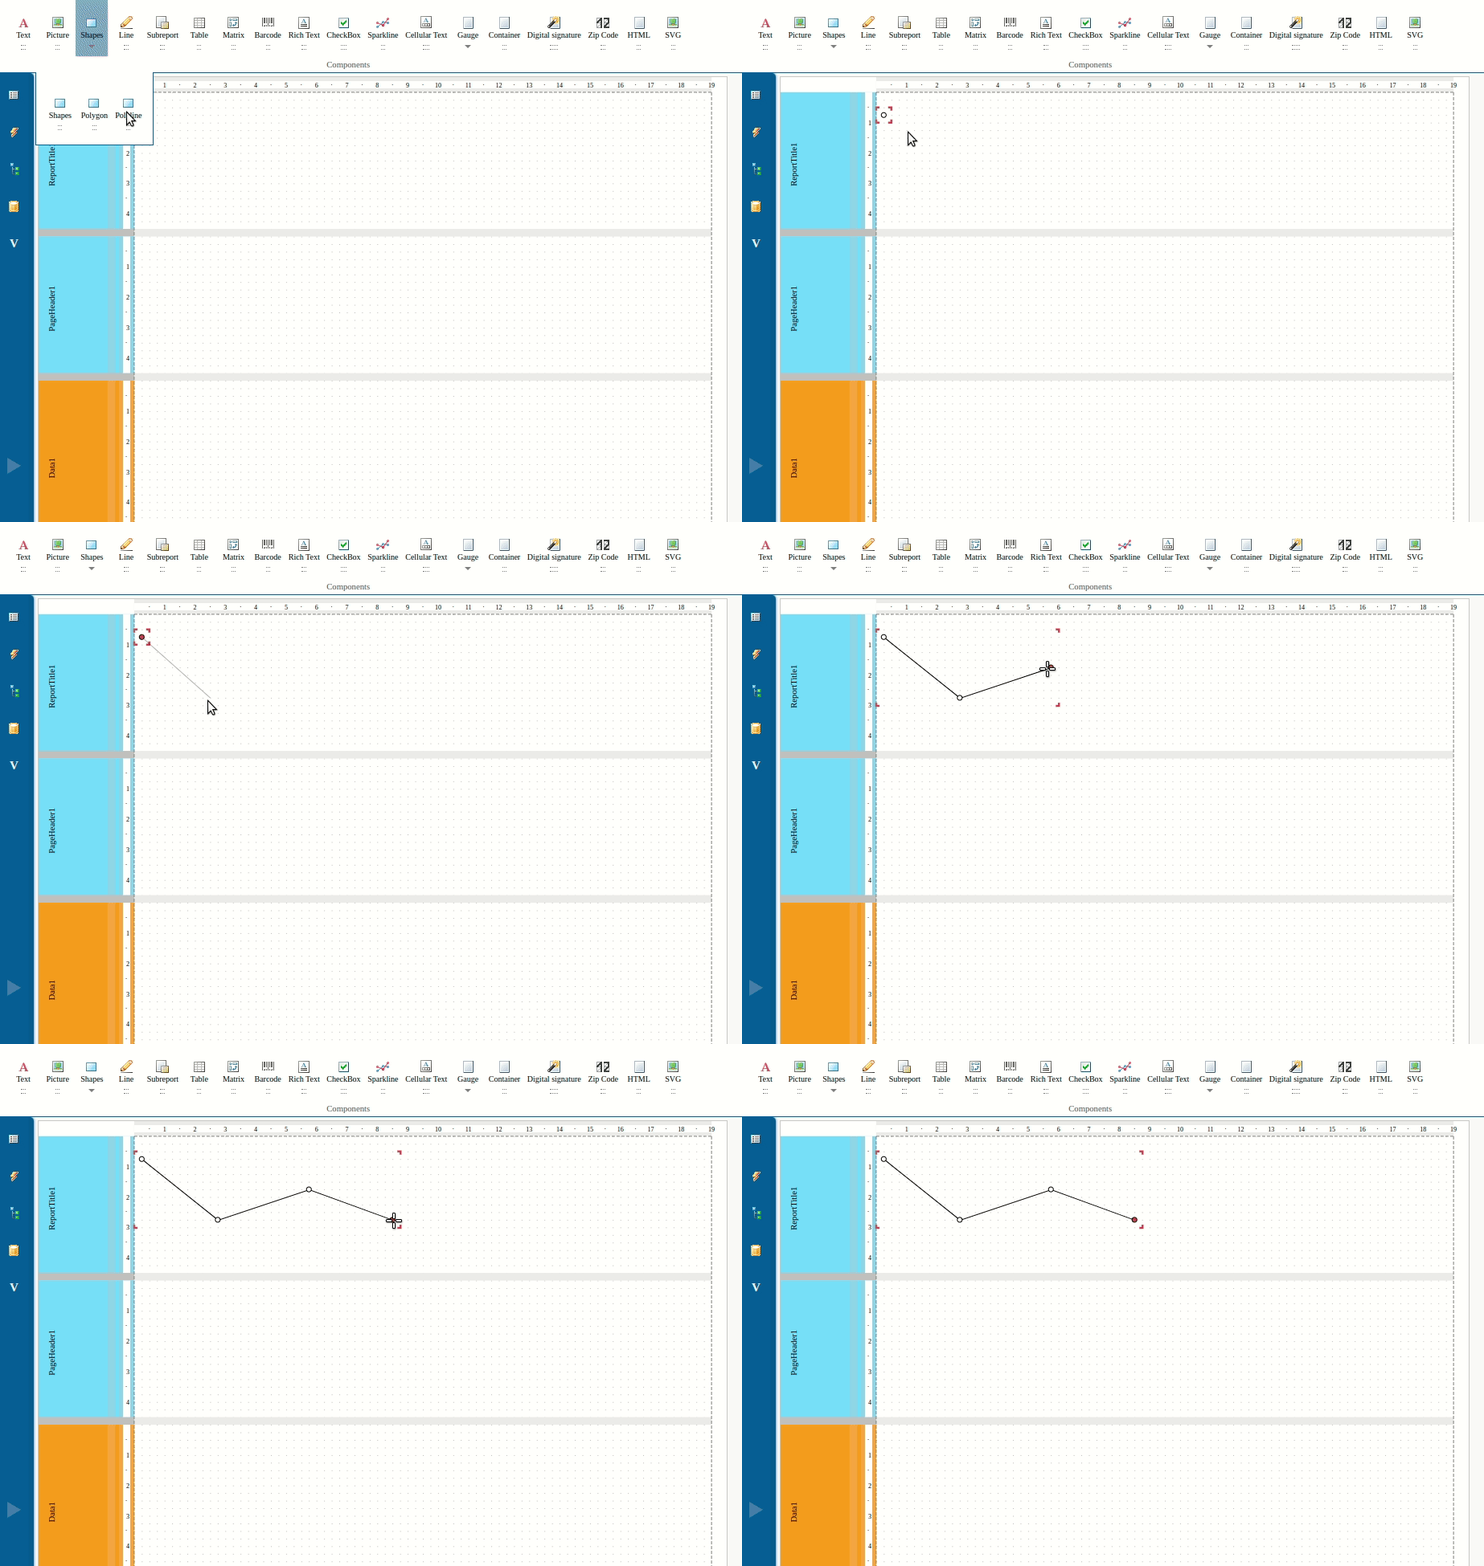
New "Polyline" and "Polygon" objects have been added:
Most often polylines are used to construct logos or other shapes of flowing lines.
The "Polyline" object allows you to build a curve by given points:
The gray lines in the image help you see how the object will look after adding a new point.
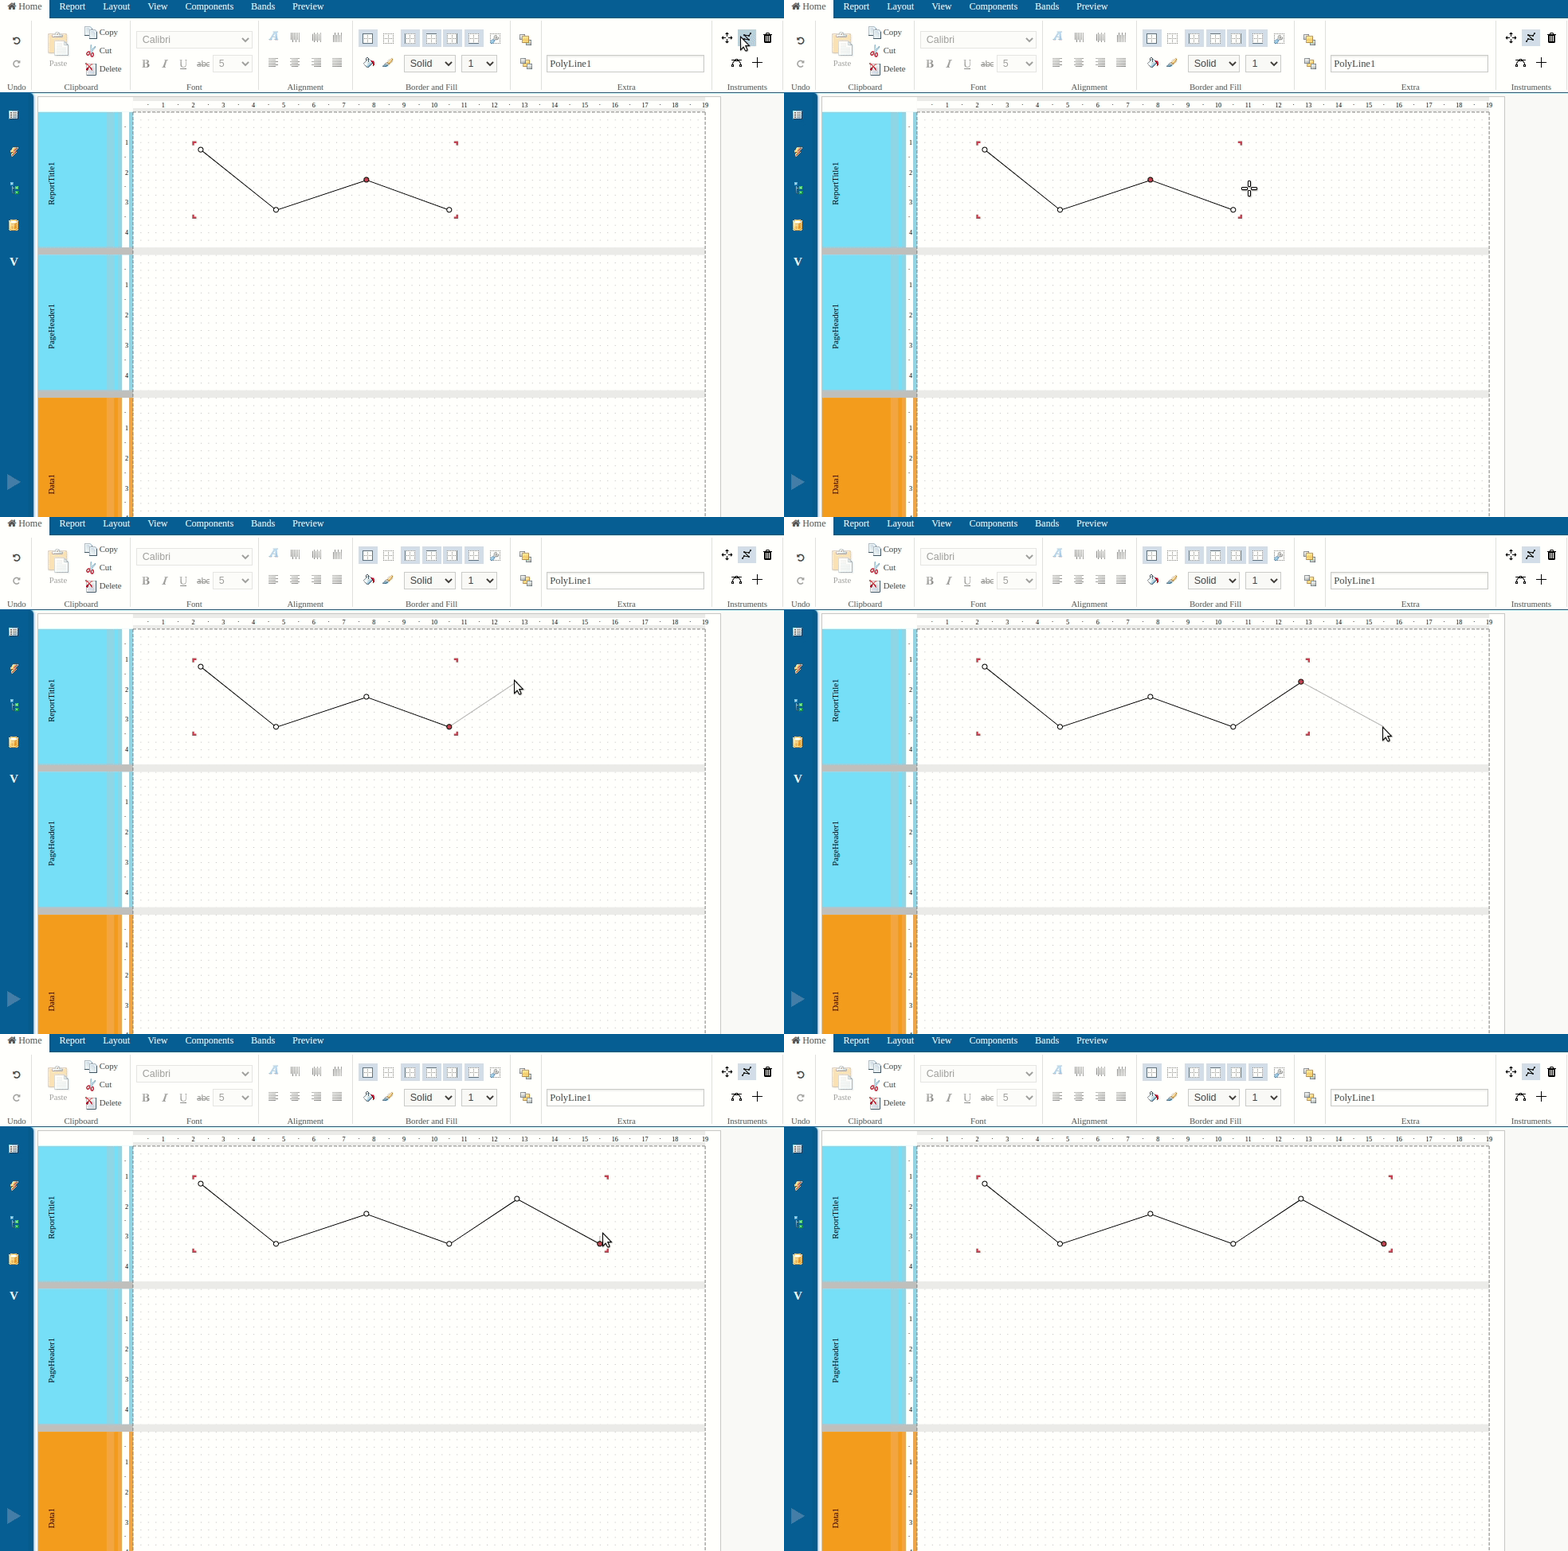
You can add new points to an already created polyline:
To stop adding points, press Escape.
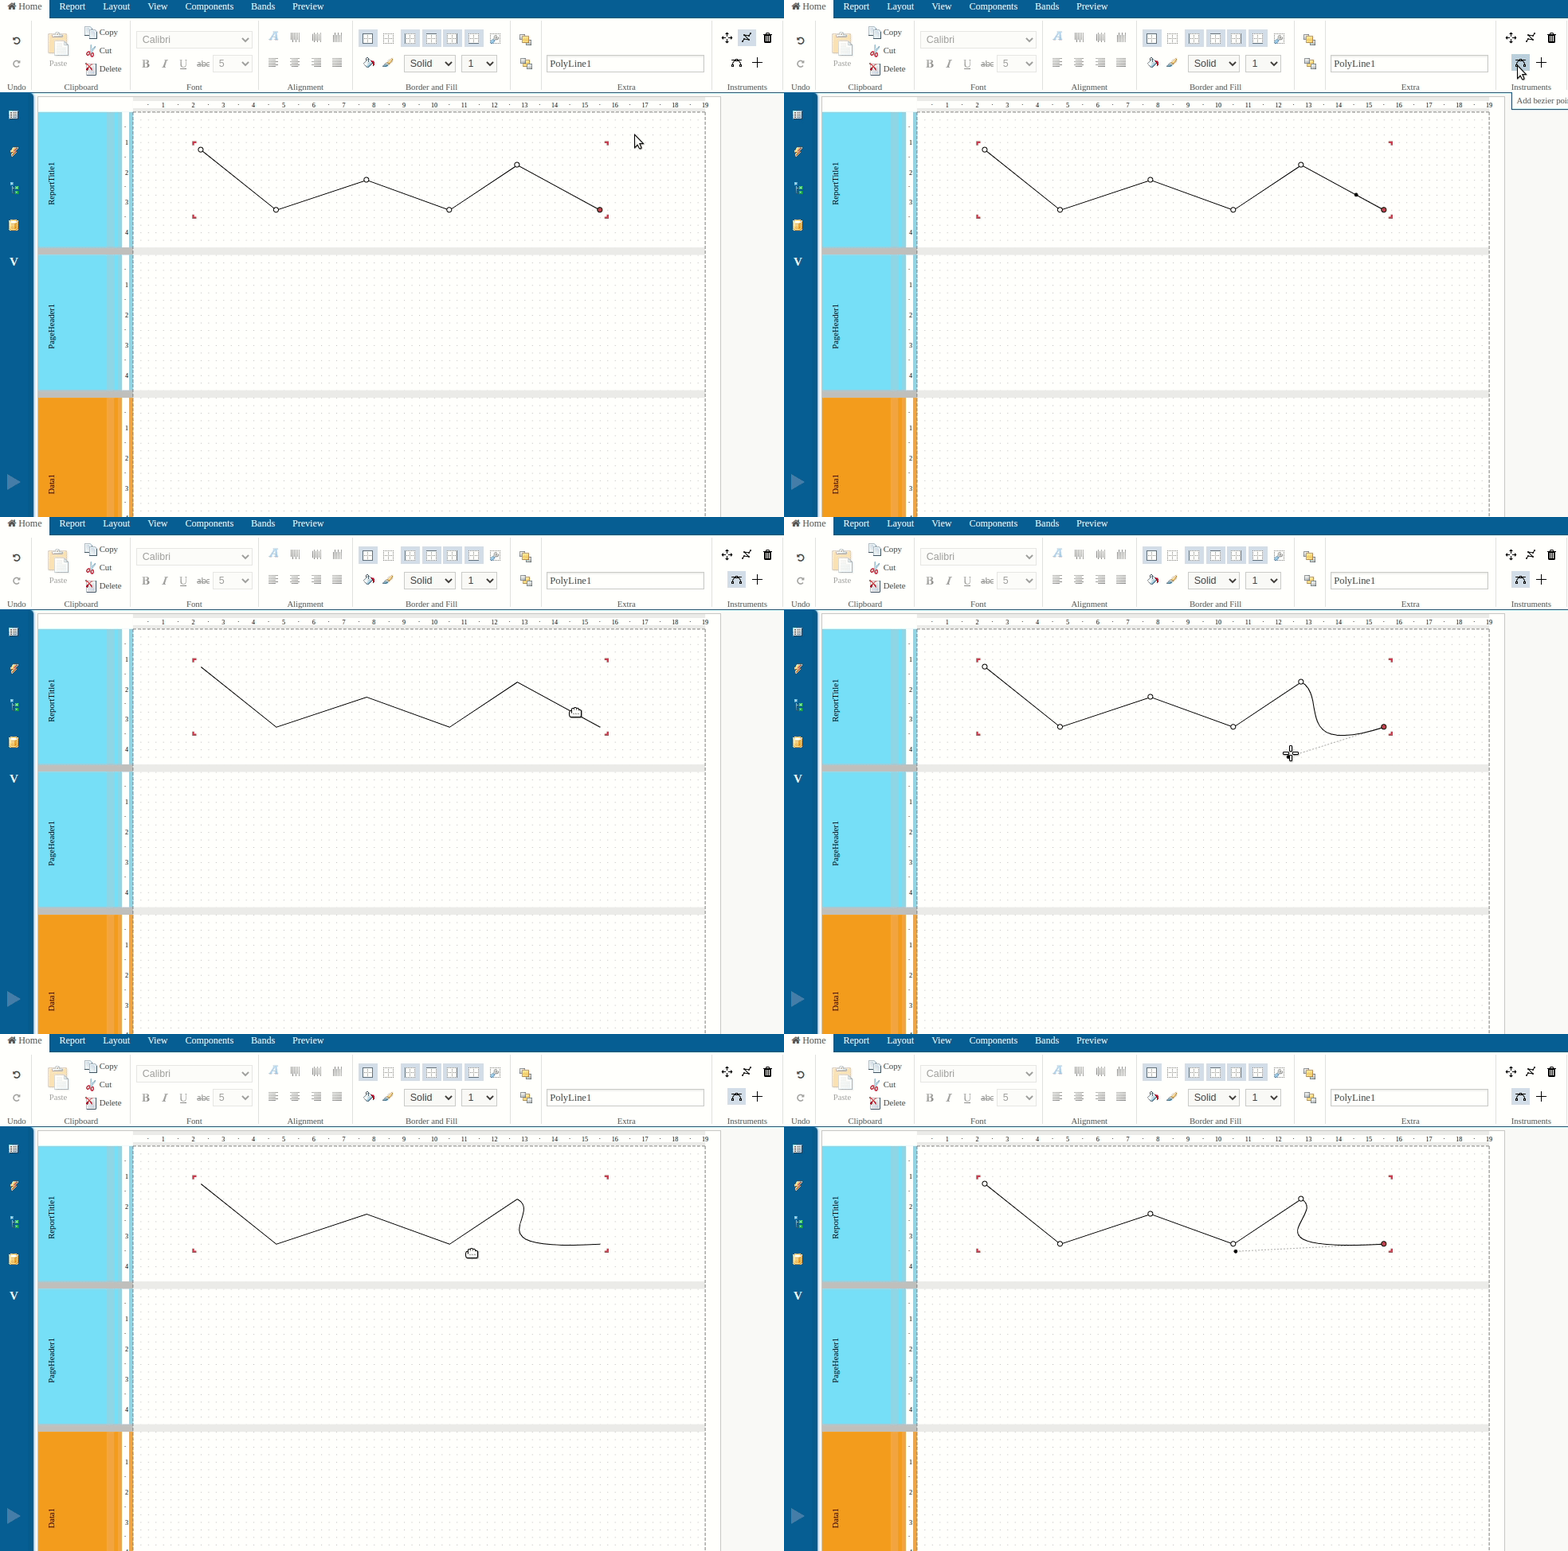
Lines can be curvatured:
The "Polygon" object allows you to build a figure by given points:
You can change the number of corners in an already created polygon by adding new points:
Polygon edges can be curvatured:
Also, you can build a polygon with preset points:
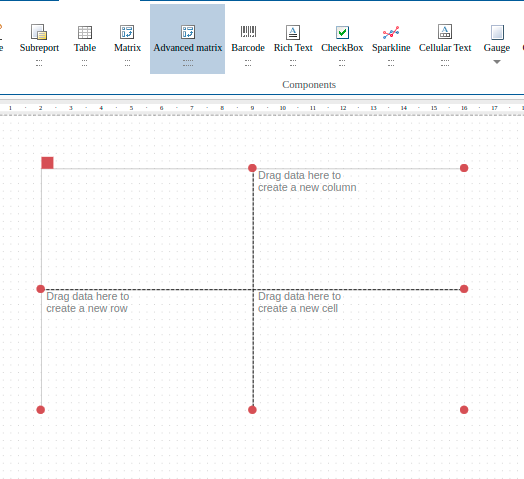
New object "Advanced Matrix" has been added:
Note: The component is in the works to improve user experience and fix bugs.
This object is similar to the advanced matrix in the desktop version of the designer. It allows you to build summary reports. You can find it in the objects panel:
Data is transferred to the matrix using drag-and-drop:
You can set the total in the header cell:
Cells can be highlighted:
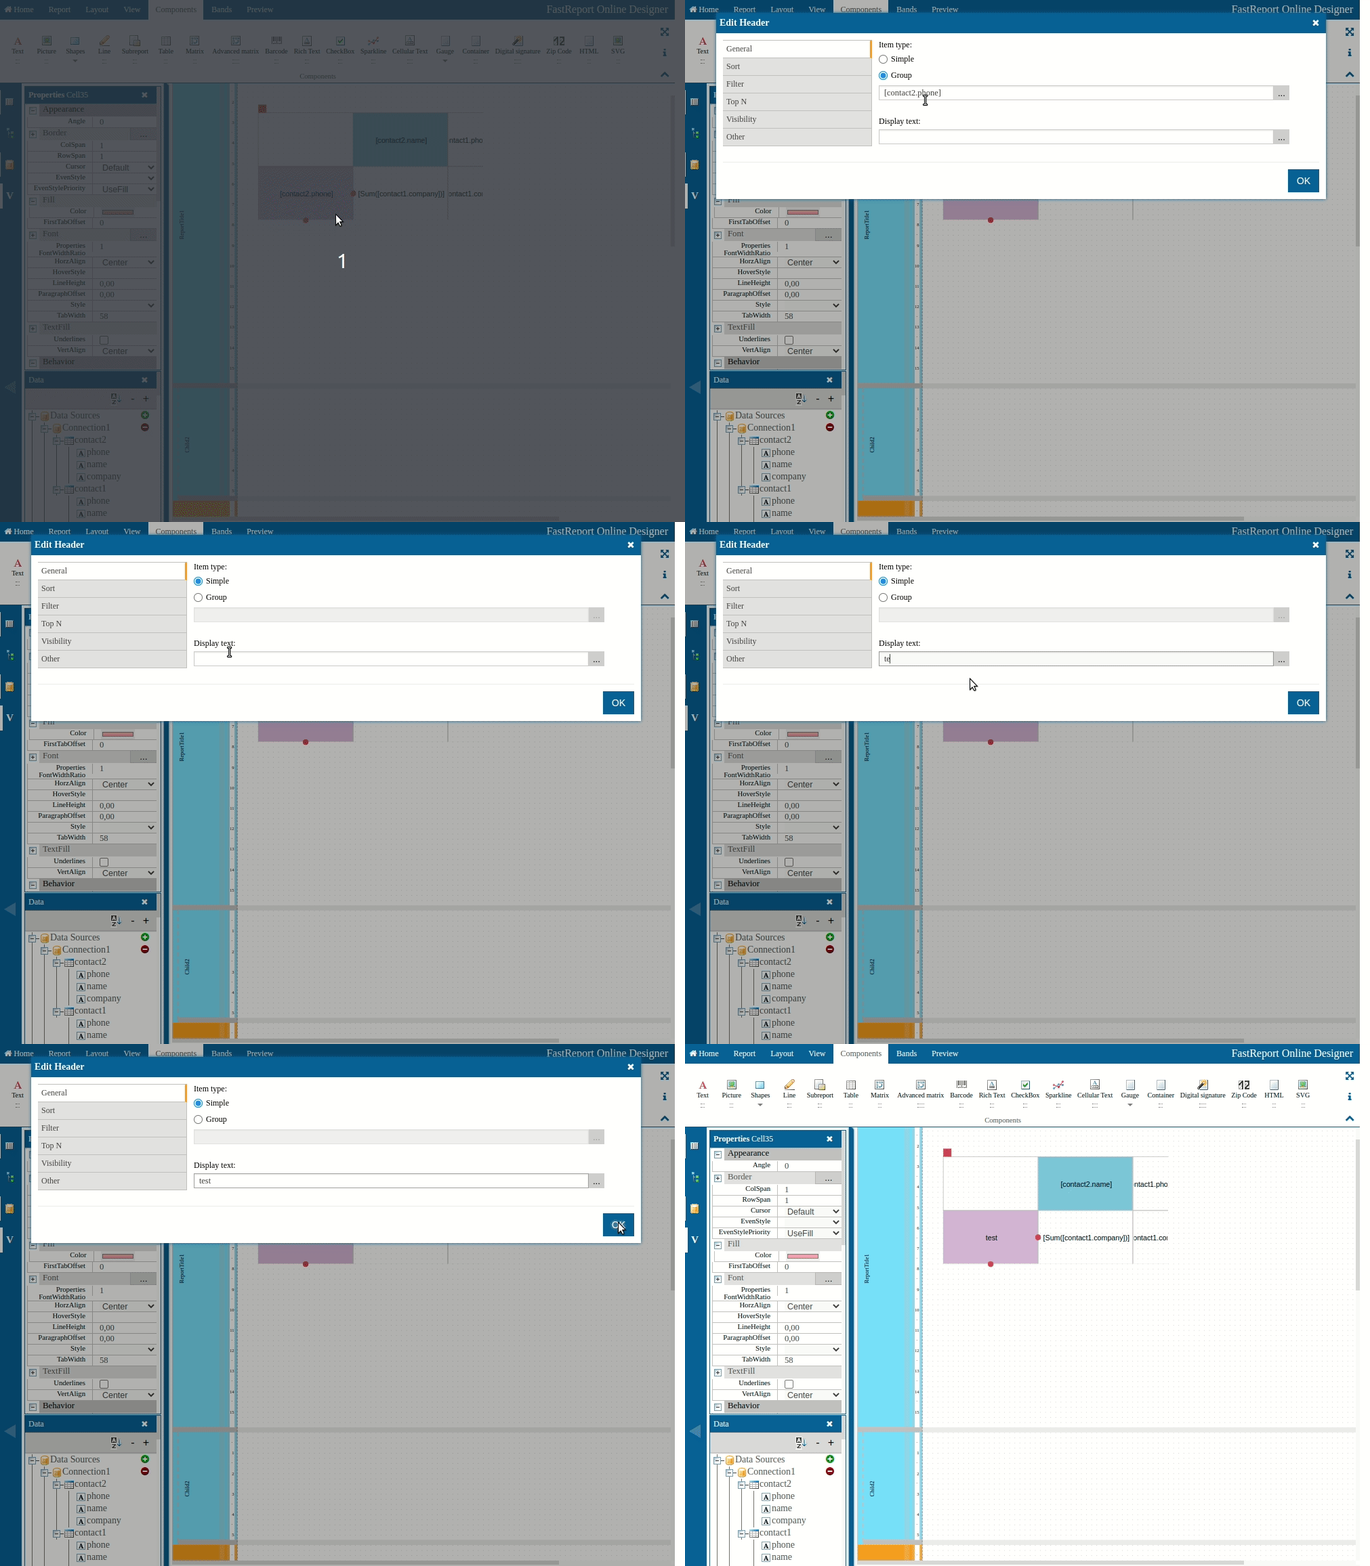
In order to go to the header cell editing window, you need to double-click on it. You can give an expression to the header cell manually:
You can also set the display text for the header cell:
Header cells can be sorted:
You can set a filter condition in the header cell:
The header cell get Top N grouping:
You can change the visibility of the header cell manually, or using a condition:
Also, you can change the display properties:
For example, this matrix template:
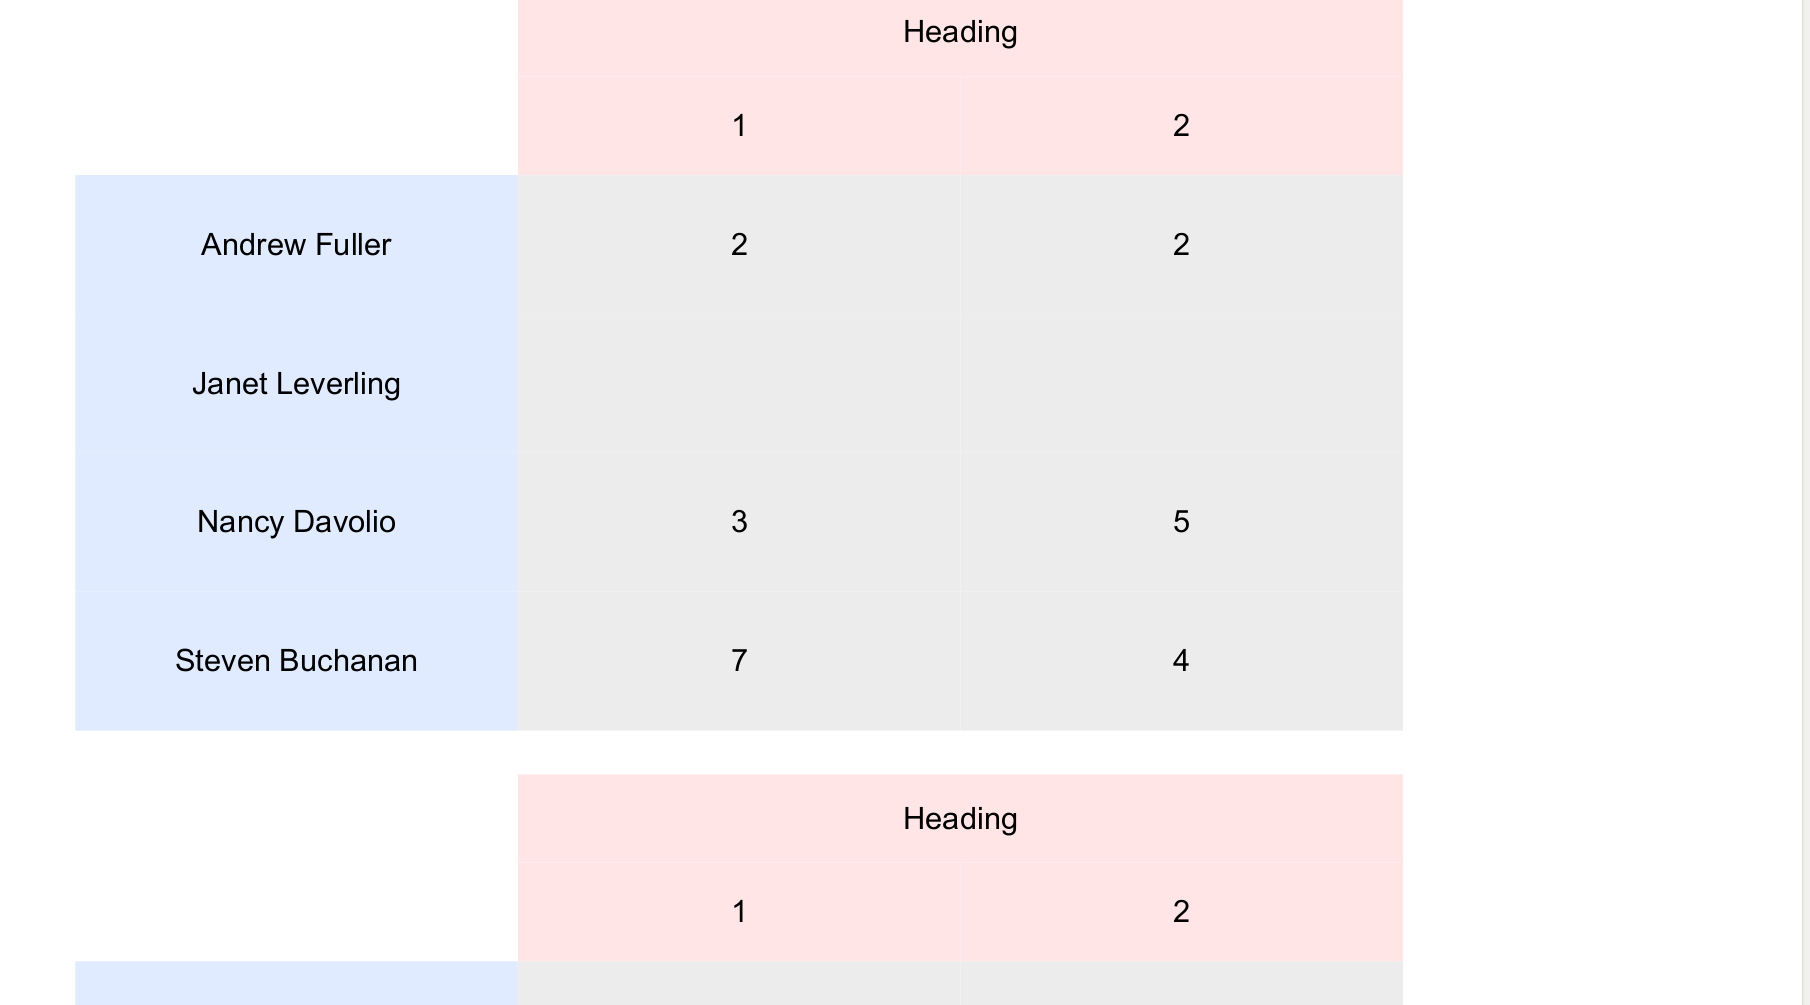
Will generate the following report:
New opportunities
Now you can collapse and expand the panel with report pages
Collapsing and expanding is done by clicking the button on the panel:
Now you can select a nested data source
For example, a JSON structure has a collection. It was not possible to use it as a data source before. Collections are now defined as the data source:
The ability to sort data sources alphabetically has been added:
This саn be done using the sort button:
The ability to collapse and expand all data sources has been added:
In order to expand data sources, click on the "+" button. Click on the "-" button to collapse data sources.
Search in the report tree has been added
In order to find the necessary element in the report tree, you can use the search field on the "Report tree" tab and enter the name of the component:
Now it is possible to add object properties to favorites
In order to add the desired property to "Favorites", you can right-click on it on the properties panel and select the appropriate item:
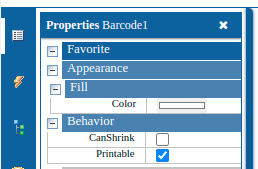
After that, the selected properties will be marked as favorites:
Each object type can have its own set of favorite properties. Each set of favorite properties is saved for later use in other report templates.
Report template AutoSave feature has been available
Now the report template is automatically saved every two minutes. Now you can’t set the save interval, but this functionality will be available in the future.
The modal report preview window has been replaced with a separate tab
Resizing of the report code editor window has been available
Now the field with the report code automatically changes height, depending on the number of rows:
Full list of changes 2022.1
--------------
+ Polyline object has been added;
+ Polygon object has been added;
+ AdvMatrix object has been added (the desktop version of the designer is not fully developed);
+ Automatic saving of the report template has been added;
+ The ability to use nested data sources has been added;
+ A separate tab for previewing the report has been added;
+ The ability to collapse or expand the panel with report pages has been added;
+ Automatic change in the height of the code editor window;
+ Button for sorting data sources has been added;
+ Buttons to collapse and expand data sources have been added;
+ Search in the report tree has been added;
+ The ability to add properties to "Favorites" has been added;
- Pasting of objects after copying or cutting has been fixed;
* Localization has been improved;
* Some other optimizations.


