Vector graphics in FastReport.Net 2019.4. Script
In the first part of the article we reviewed the innovations of FastReport.Net 2019.4 in terms of vector graphics. Now polylines and polygons can be constructed by Bezier curves. In this article, we will consider the possibility of creating curves using a report script.
Currently there are two ways to create curves from code: use a PolyLineObject object or load a polygon from an SVG.
As you know, any report object is available in the report script, so we can use PolyLineObject to set points and connect them to create a shape. Run the code before displaying the object, which means you need to create a BeforePrint event handler for the Polygon object. Let's look at a real example.
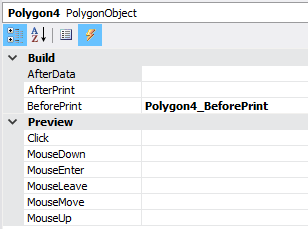
Add a Polygon object to the report page. In order not to create key points of the shape, just press Esc. In the object property inspector select Events. Create a BeforePrint event handler:
Let's write the following code in the handler:
1 2 3 4 5 6 7 8 9 10 11 12 13 14 15 16 17 18 19 20 21 22 23 24 25 26 27 28 29 30 31 32 33 34 |
private void Polygon4_BeforePrint(object sender, EventArgs e) { // Create a star shape int spikes = 5; //Number of spikes PolyLineObject obj = sender as PolyLineObject; PolyLineObject.PolyPointCollection points = obj.Points; points.Clear(); const float outerRadius = 70; //External radius const float innerRadius = 30; //Internal radius float rot = (float)(Math.PI / 2 * 3); // Tilt angle const float cx = 0; const float cy = 0; float x = cx; float y = cy; float step = (float)(Math.PI / spikes); // Vertex creation step obj.Width = 100; obj.Height = 100; obj.CenterX = 50; obj.CenterY = 50; points.Add(new PolyLineObject.PolyPoint(cx, cy - outerRadius)); //Add points for (int i = 0; i < spikes; i++) { // Coordinates of interior points x = cx + (float)Math.Cos(rot) * outerRadius; y = cy + (float)Math.Sin(rot) * outerRadius; points.Add(new PolyLineObject.PolyPoint(x, y)); rot += step; // Next point // Coordinates of external points x = cx + (float)Math.Cos(rot) * innerRadius; y = cy + (float)Math.Sin(rot) * innerRadius; points.Add(new PolyLineObject.PolyPoint(x, y)); rot += step; } } |
As a result, we get a star:

In the example above, we calculated the coordinates to build the shape, but if you already have a list of coordinates, then simply add them to the collection of points: points.Add(new PolyLineObject.PolyPoint(x, y));
But what if the shape is much more complicated than the example above? The amount of code to create it will be too large. In this case, you can use the object SVG. For example, its path property. We can convert a set of elements of the svg image path into points and build a polygon using them. It is important to consider Bezier curves. How to do this, you will see below in the code:
1 2 3 4 5 6 7 8 9 10 11 12 13 14 15 16 17 18 19 20 21 22 23 24 25 26 27 28 29 30 31 32 33 34 35 36 37 38 39 40 41 42 43 44 45 |
private void PolyLine2_BeforePrint(object sender, EventArgs e) { PolyLineObject obj = sender as PolyLineObject; PolyLineObject.PolyPointCollection points = obj.Points; points.Clear (); // Svg builder along the way SvgPathBuilder builder = new SvgPathBuilder (); // Load the list of segments from the string SvgPathSegmentList list = builder.ConvertFromString ("M91.734 10.5L66.6384 59.025 10.5 66.8258l40.643 37.749-9.5696 53.327 50.2094-25.1932 50.234 25.1582-9.6124-53.321 40.6154-37.778-56.1505-7.76z") as SvgPathSegmentList; GraphicsPath _path = new GraphicsPath (); foreach (SvgPathSegment segment in list) { segment.AddToPath (_path); } PolyLineObject.PolyPoint point = null; for (int i = 0; i < _path.PointCount; i++) { PointF pnt = _path.PathPoints[i]; byte type = _path.PathTypes[i]; // If you have a curve, you have to consider three contractors. if (type == 3) { PointF pnt1 = _path.PathPoints[i]; PointF pnt2 = _path.PathPoints[i + 1]; PointF pnt3 = _path.PathPoints[i + 2]; i += 2; // Curvature to the right point.RightCurve = new PolyLineObject.PolyPoint (pnt1.X - point.X, pnt1.Y - point.Y); //Point point = new PolyLineObject.PolyPoint (pnt3.X, pnt3.Y); // Curvature to the left point.LeftCurve = new PolyLineObject.PolyPoint (pnt2.X - point.X, pnt2.Y - point.Y); } else { // Ordinary point point = new PolyLineObject.PolyPoint (pnt.X, pnt.Y); } // Add points points.Add (point); } obj.CenterX = 0; obj.CenterY = 0; obj.RecalculateBounds (); obj.Top = 0; obj.Left = 0; } } |
This code will show us a star of this type:

In the list of type SvgPathSegmentList we place elements from the path tag of the SVG file. Then, we obtain the coordinates of the points and add them to the PolyLine object. In this example, we have displayed the object in straight line segments, but you can also use curves, for example:
…
SvgPathSegmentList list = builder.ConvertFromString ("m101.87775,57.26873c31.12829,-82.10042 153.08994,0 0,105.55768c-153.08994,-105.55768 -31.12829,-187.65809 0,-105.55768z") as SvgPathSegmentList;
…
As a result, we get:

It is necessary to take into account that the coordinate plane is the band on which the Polyline or Polygon object is located. Therefore, it does not matter where in the band you placed the object. It will be displayed according to the specified coordinates.
Using the second method we considered creating a polygon from a script, you will be able to display the previously created vector drawings. There is no need to spend a lot of time manually creating a polygon.