Turn database data into a document in Delphi / Lazarus / C++ Builder
How to make a mush of data into an informative report?
Oracle DB, MySQL, Microsoft SQL Server, PostgreSQL, FireBird are probably the most popular, but by no means all, of the many DBMSs in which data can be created, populated, modified and managed.
Often they are filled with this very data for quite a long time (e.g. in timekeeping systems, goods-orders, and the question "how to get information out of them?" (readable, encompassable by sight and human mind, for further analysis) is put off for later. Let's consider what to do "then" - when we have a "full database" and we (or the company's management) have wondered "what's actually happening? Let's make effective use of the data we collect in the process, derive information from that data and make decisions based on that information!". Basically, this is the definition of Business Intelligence (BI) in plain language.
There are many possibilities to create them (reports), but here we will look at FastReport VCL. There's a designer for generating templates, a preview and many other features to perform different levels of tasks - we've looked at them in other articles, but we still haven't looked at all of them.
FastReport can work with several data sources (databases) at the same time, or retrieve them from so-called user sources (not databases) - arrays or regular files.
How to get information from DB in Delphi?
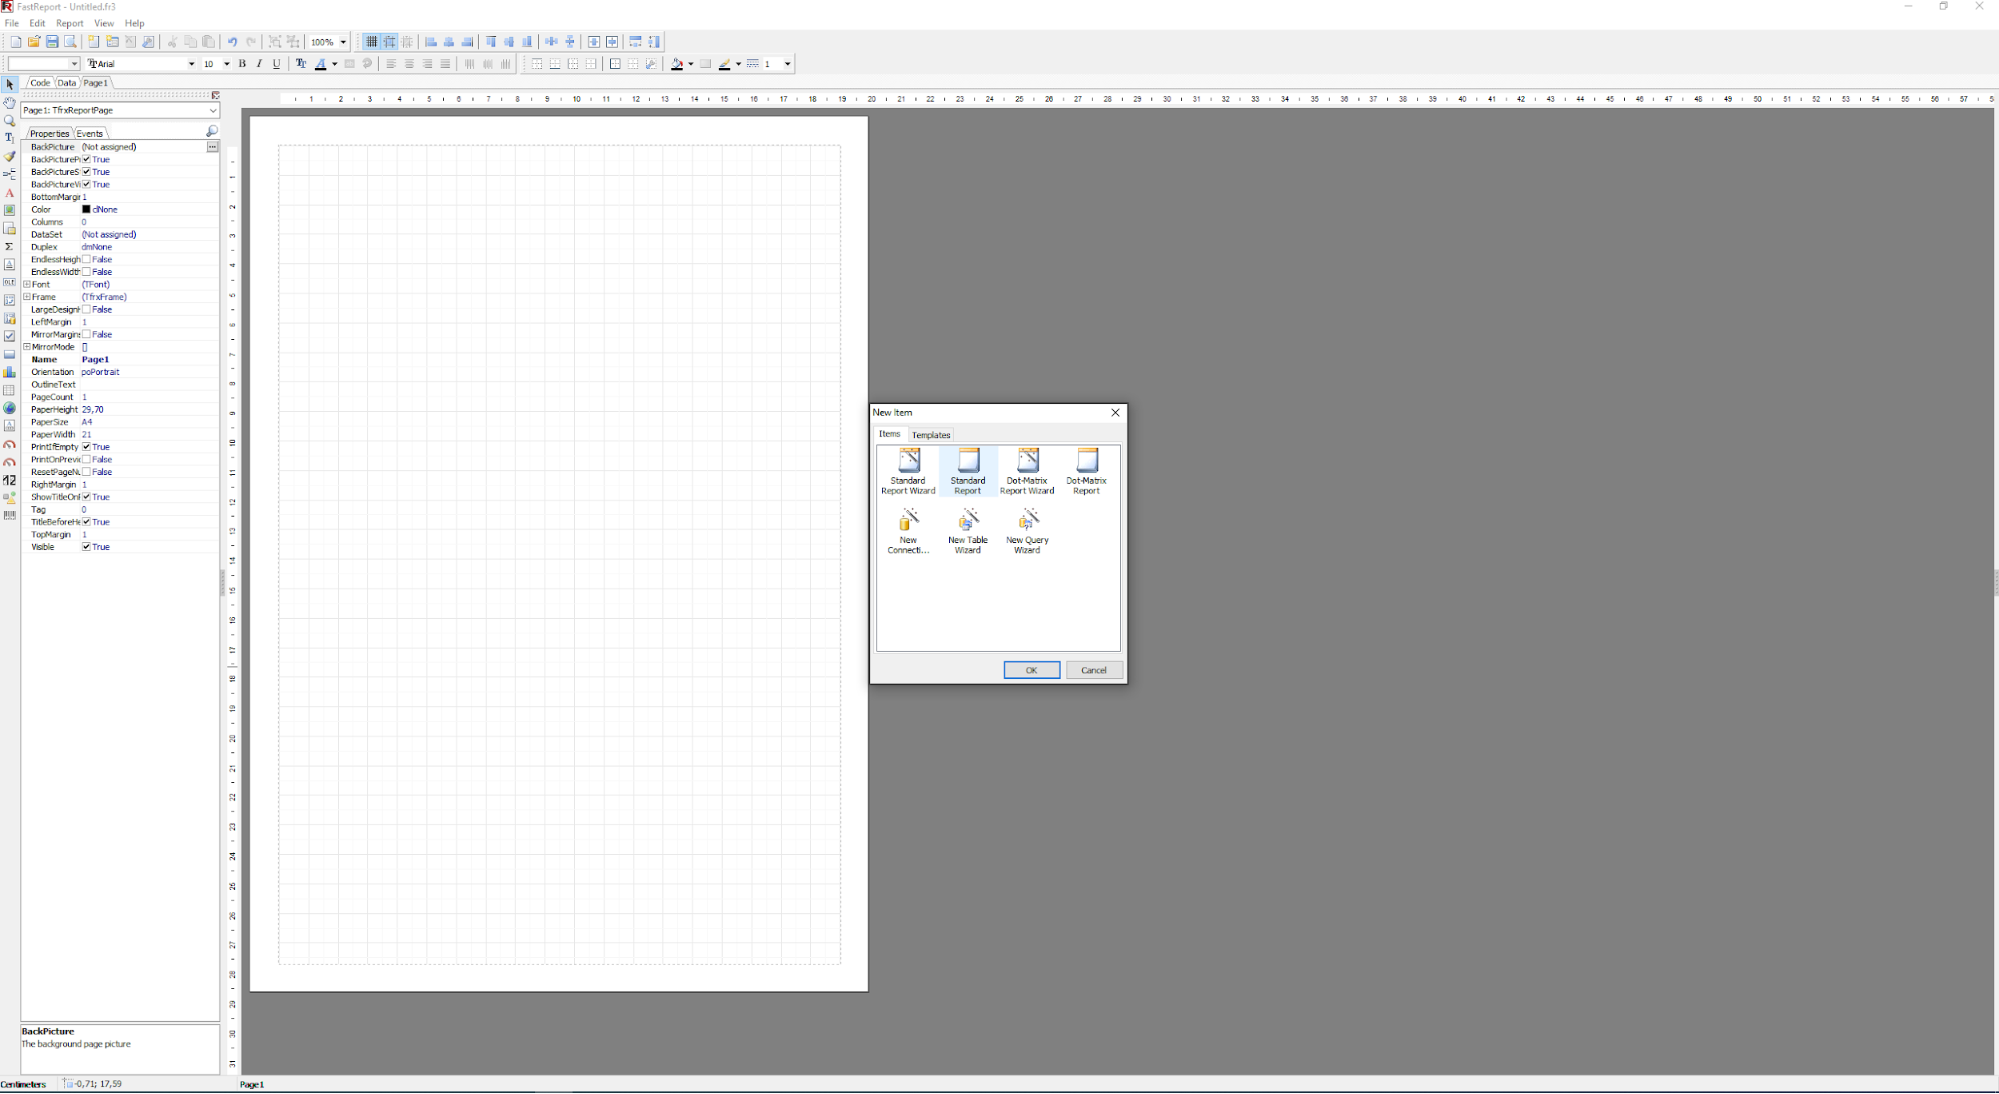
In order to connect the data source, a connector (TfrxDBDataSet) must be applied from the component palette. This is the link between the data and FastReport.
Now I will tell you briefly about the role of the components:
TfrxDBDataSet is an element used to work with data source, it is also compatible with TDataSet, but TfrxIBODataSet is used for IB Objects, also TfrxUserDataSet is used for other resources - arrays, files, etc.
First of all, using the DataSet property, connect to the query or table itself, well, or DataSource (it connects to the TDataSource component).
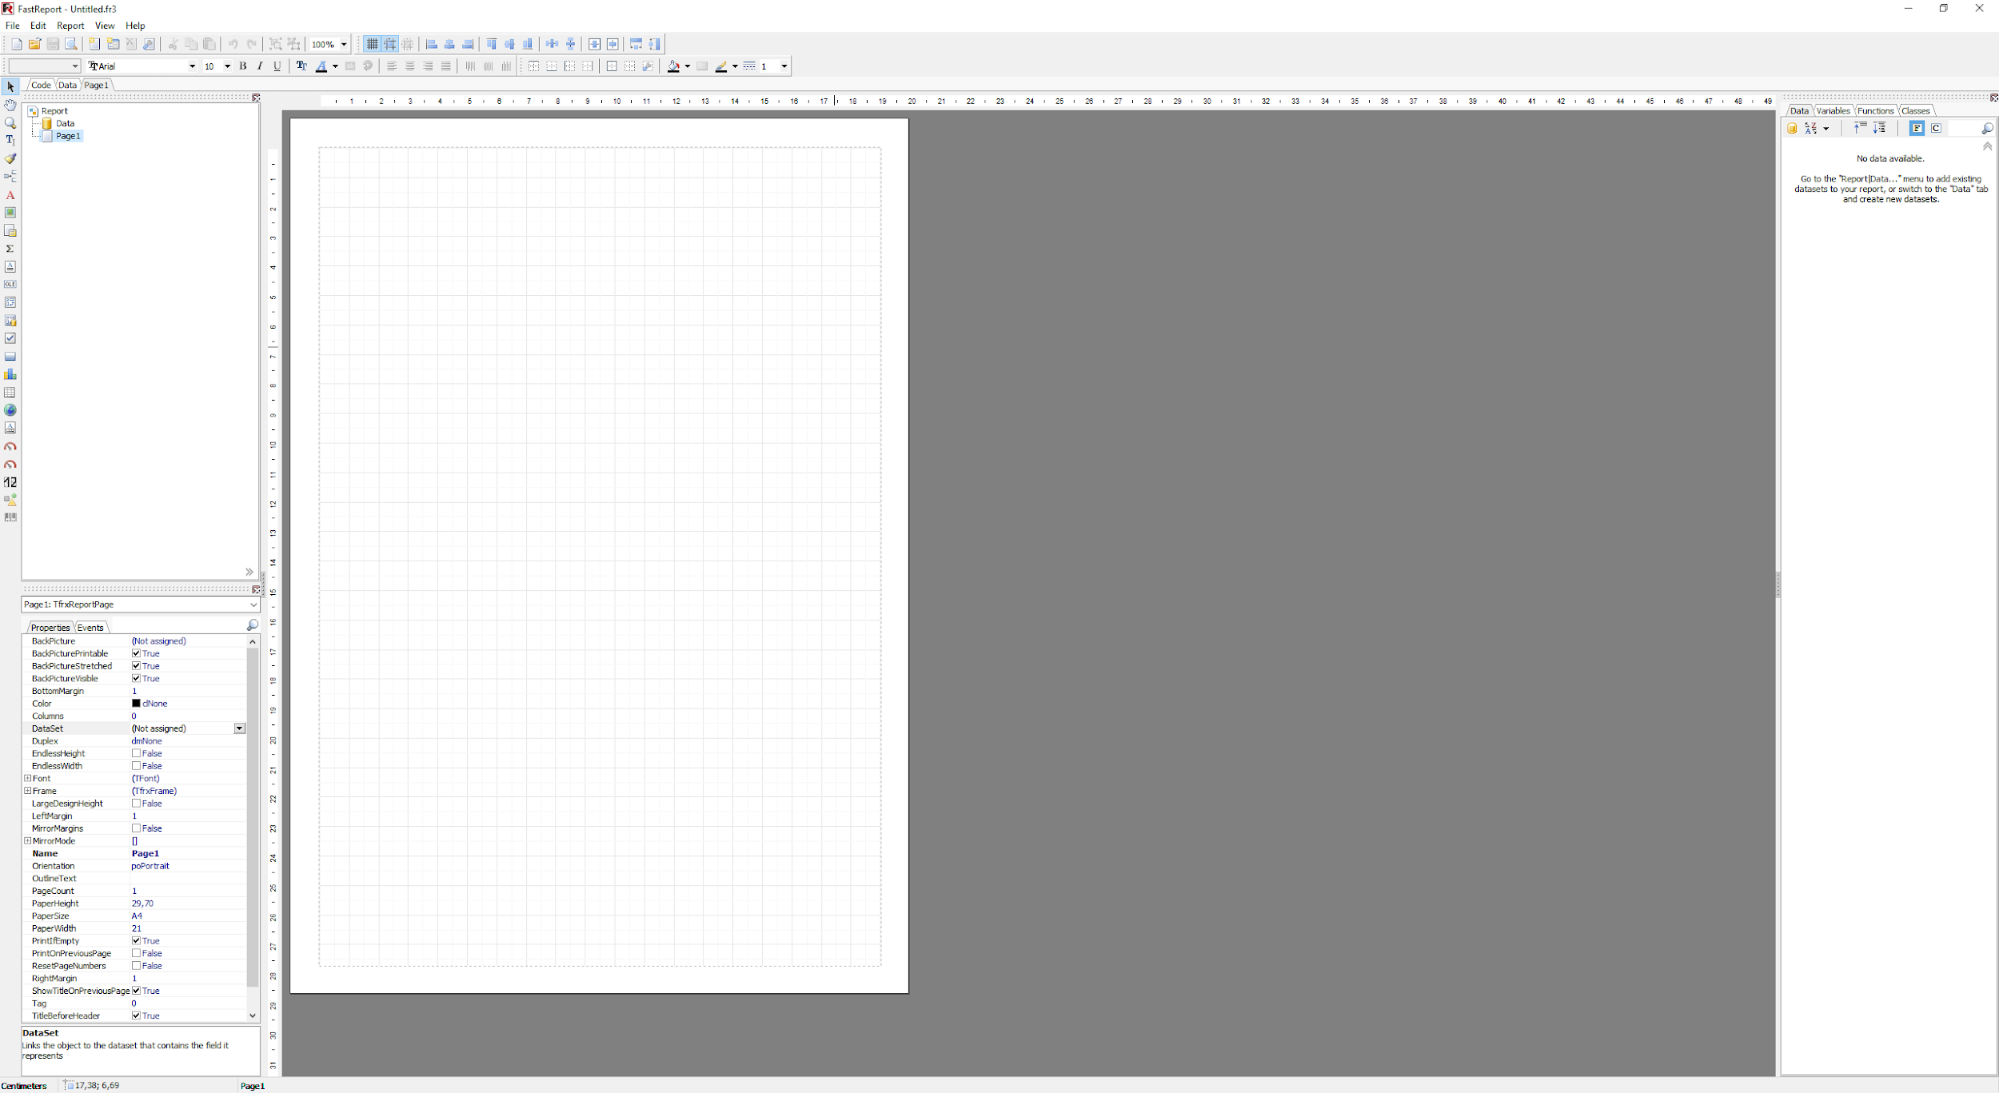
For the data to already be in the report, you will need to specify which of them will go into our report! This is also easy to do.
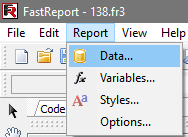
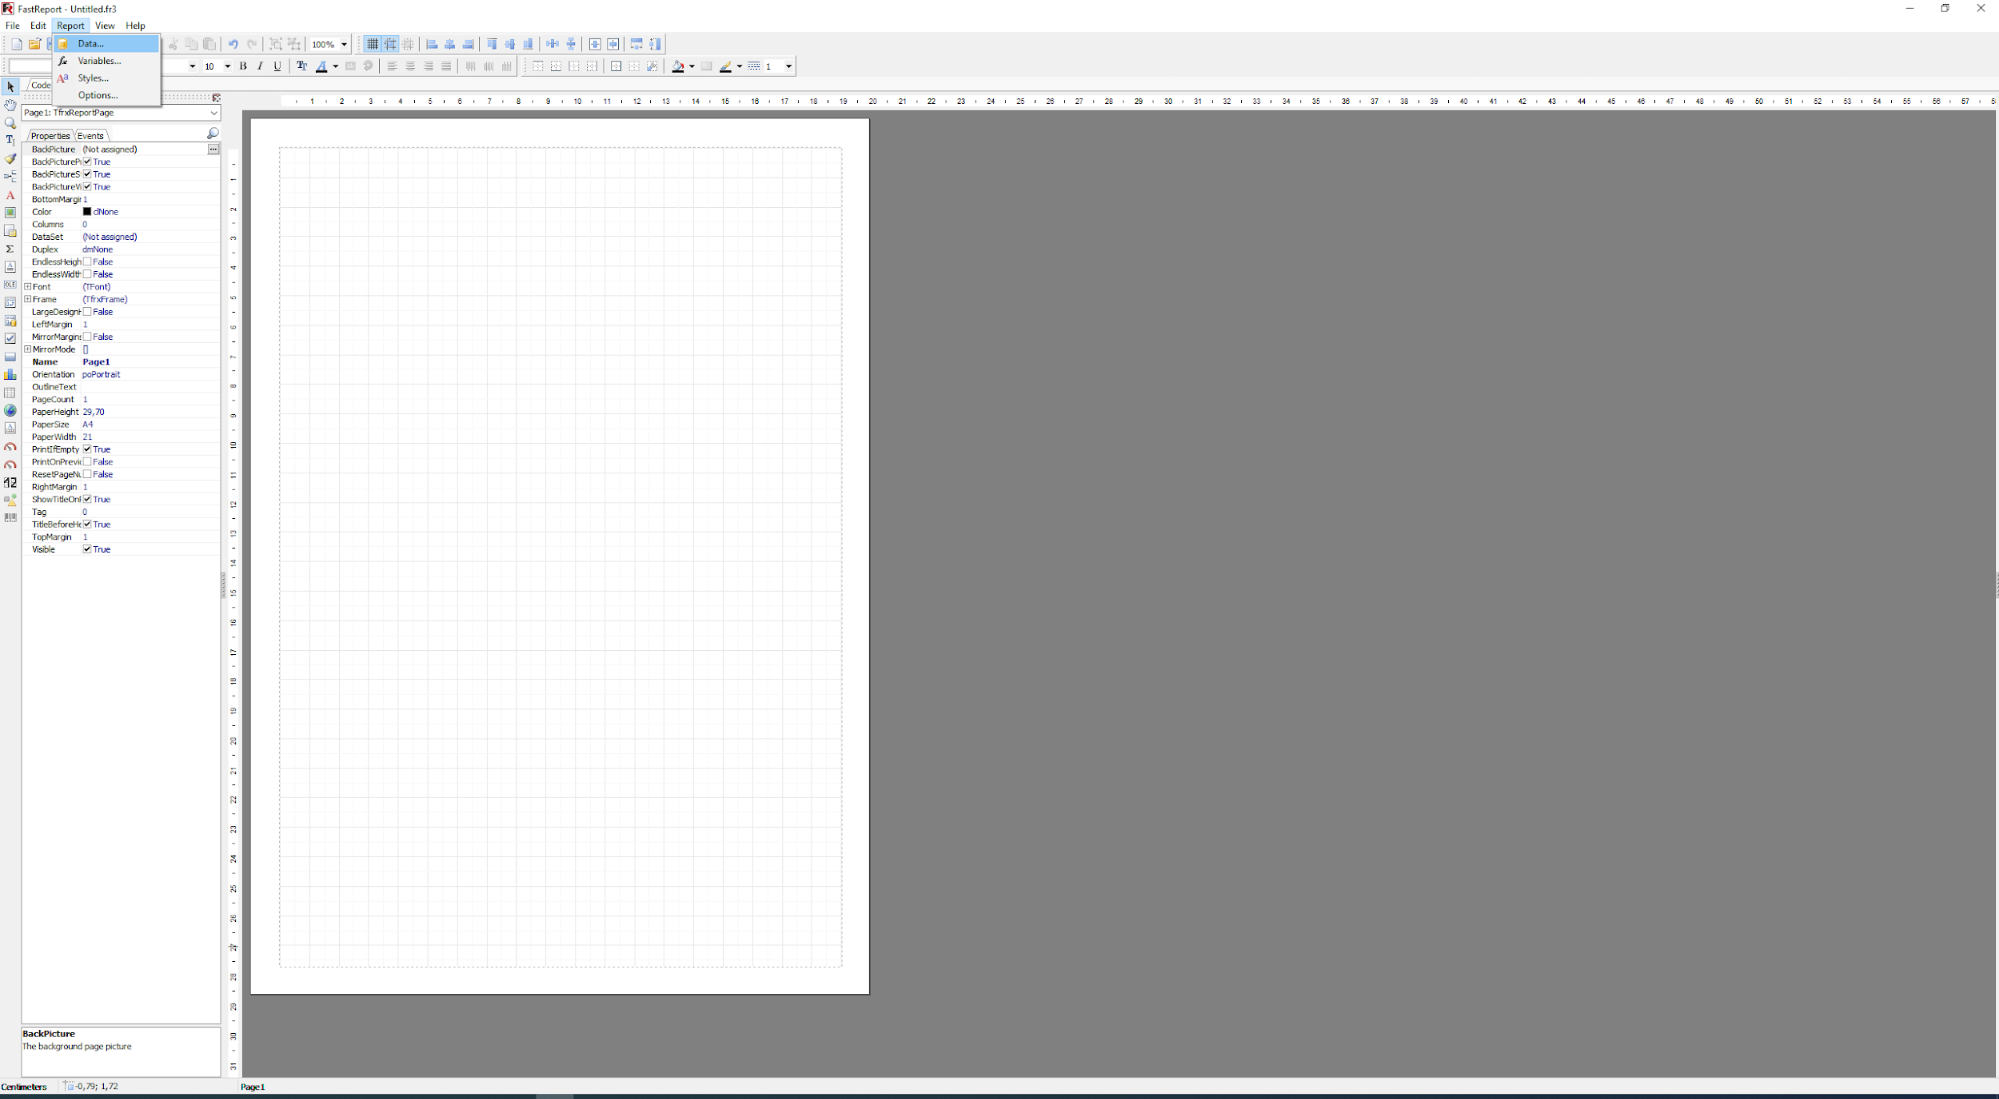
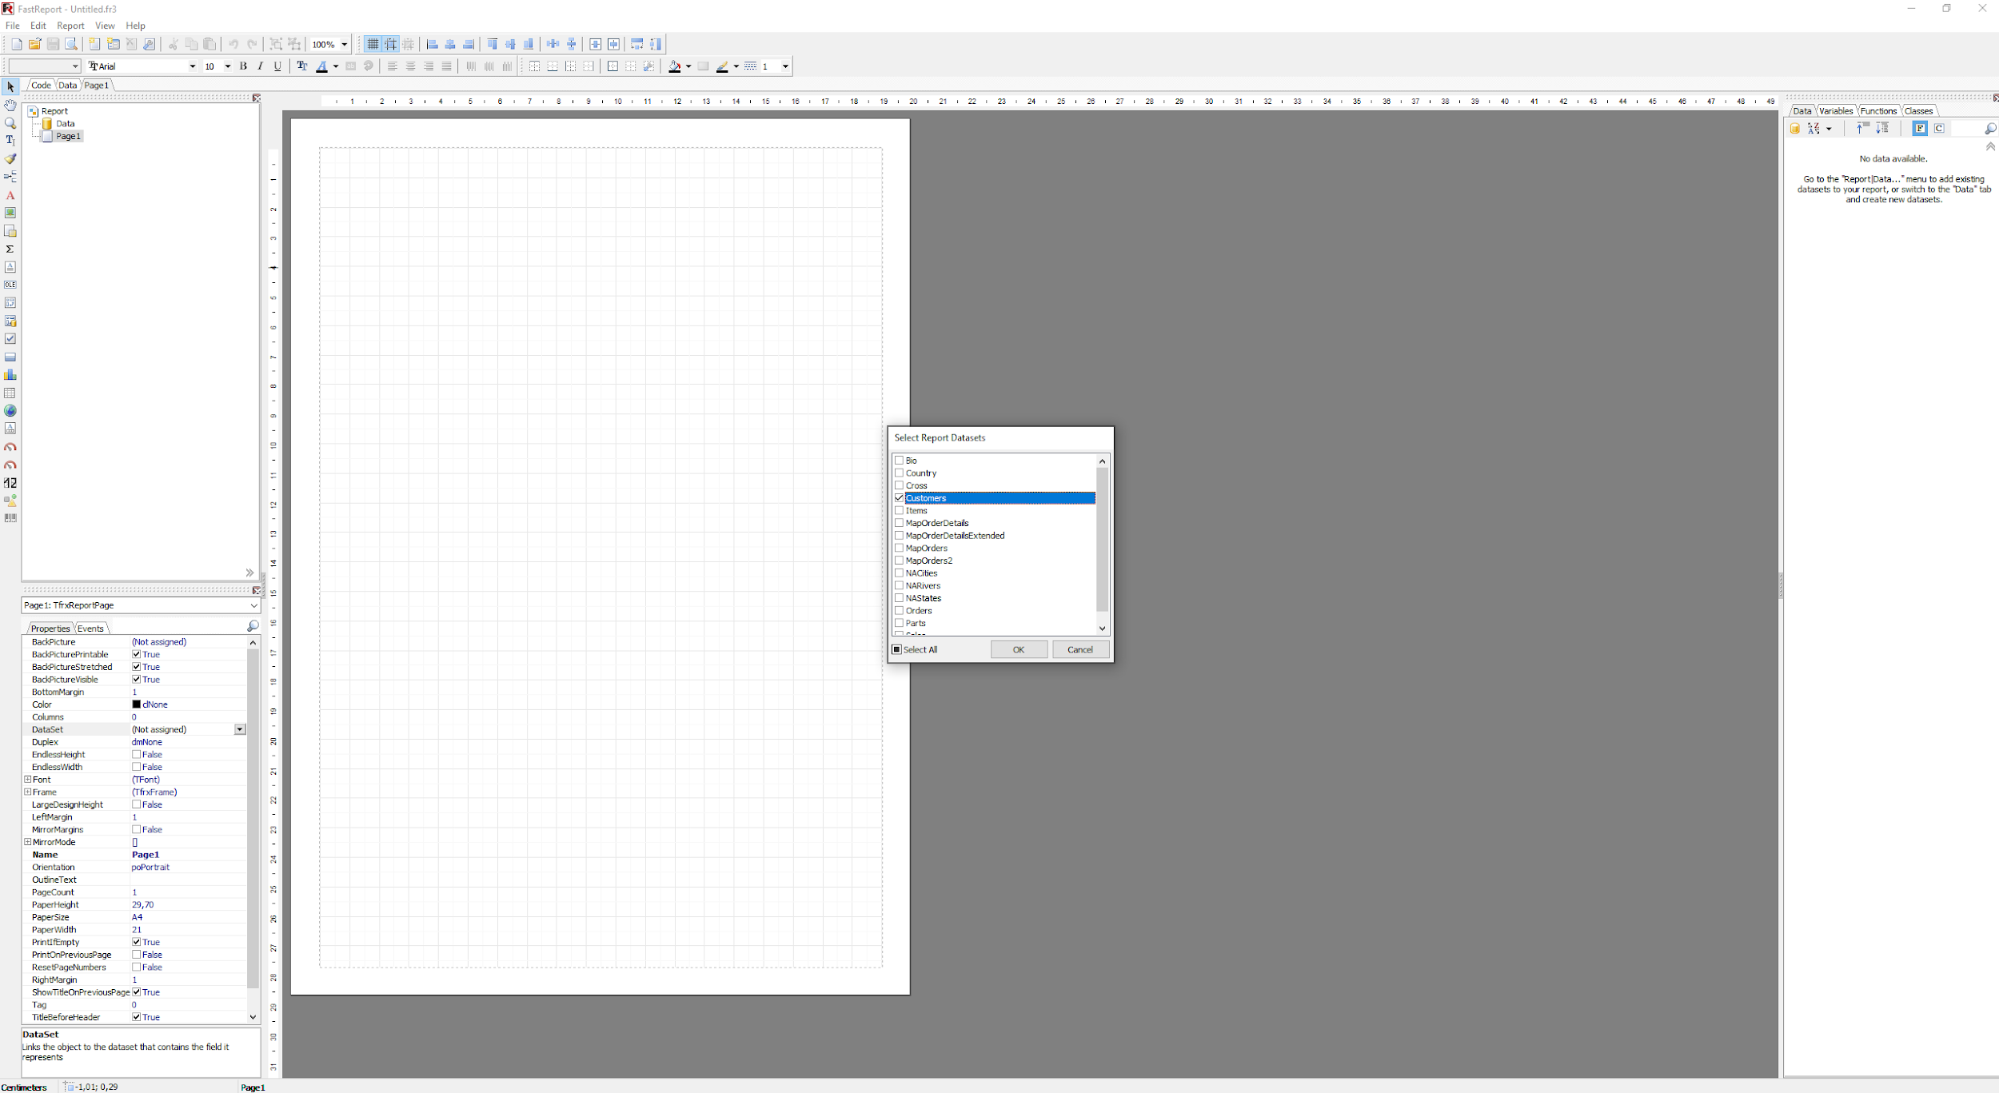
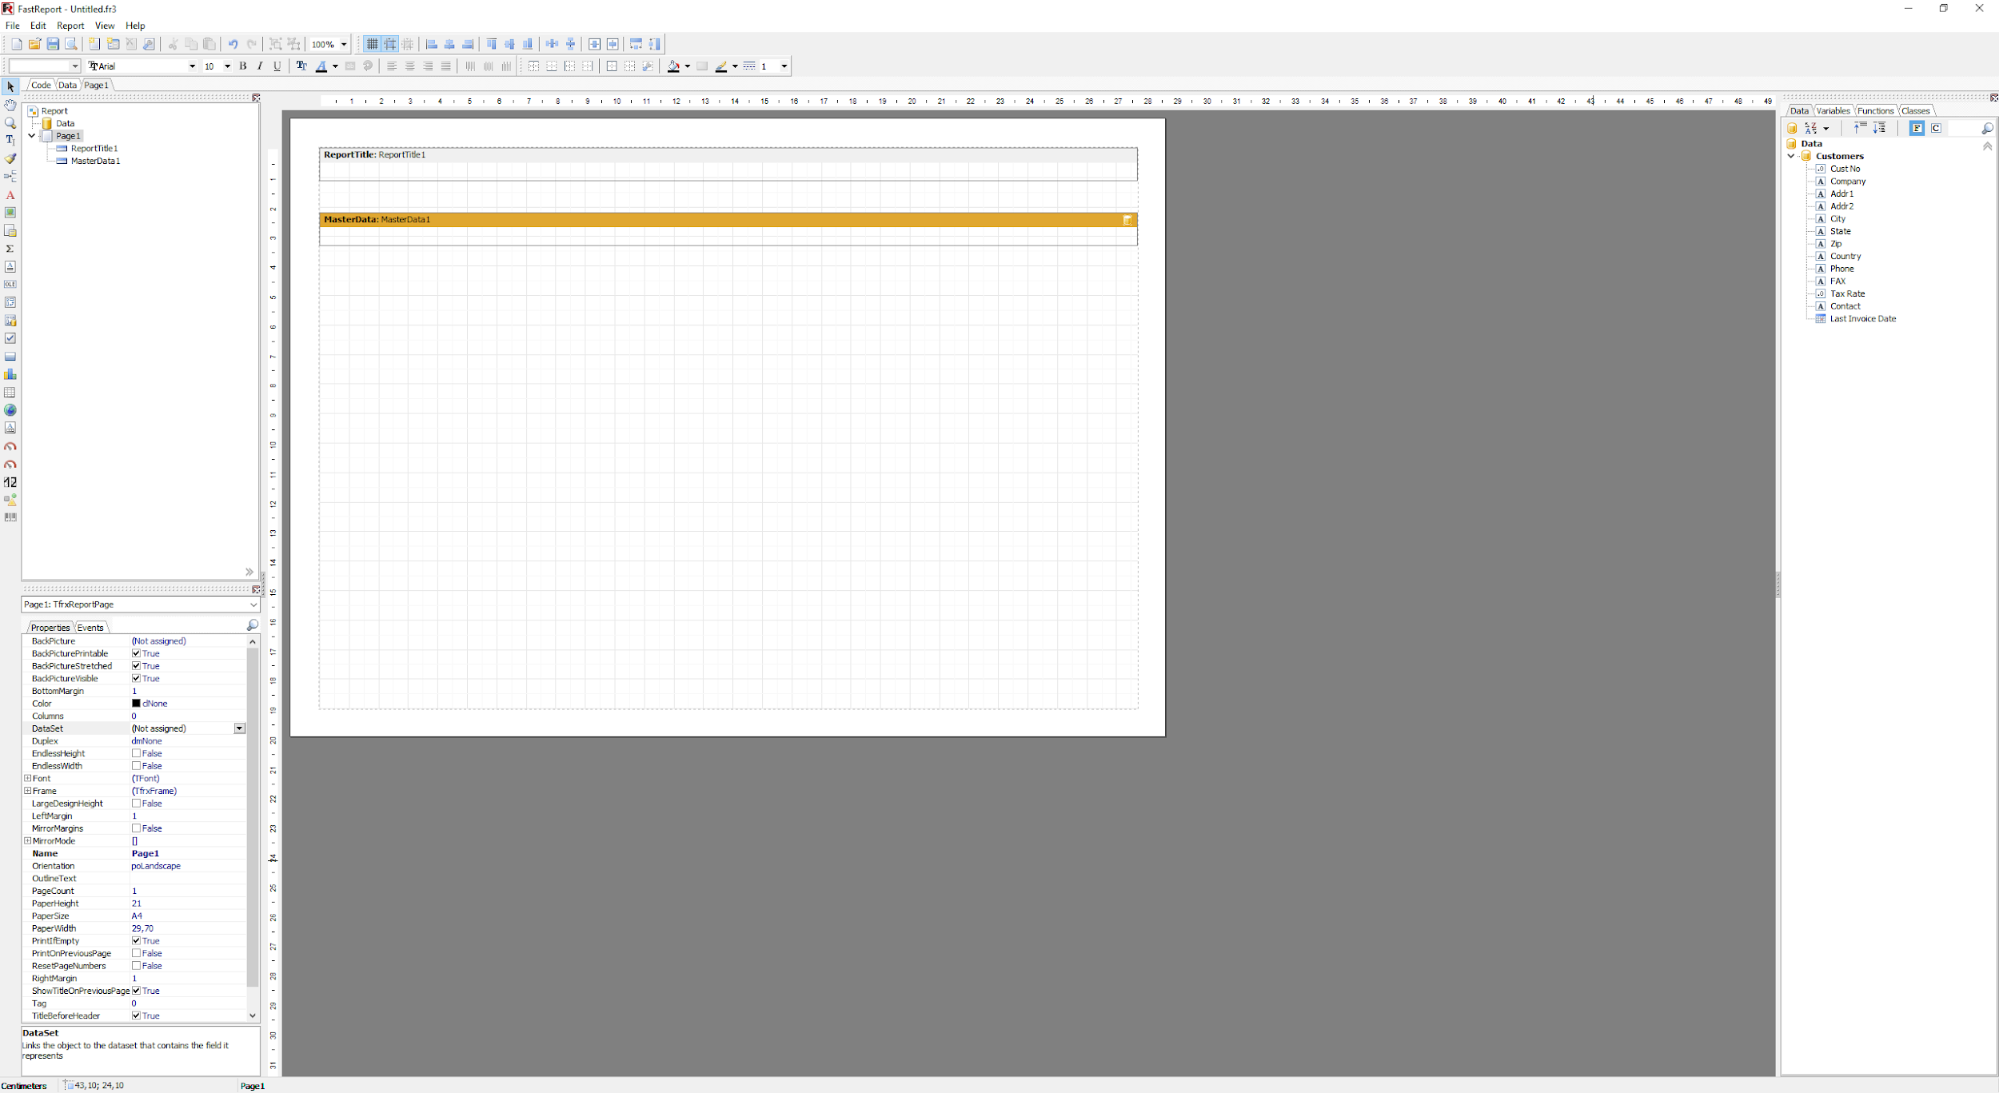
Select in FastReport VCL designer in menu Report -> Data.
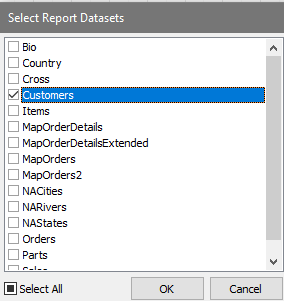
Select necessary elements and click “OK”!
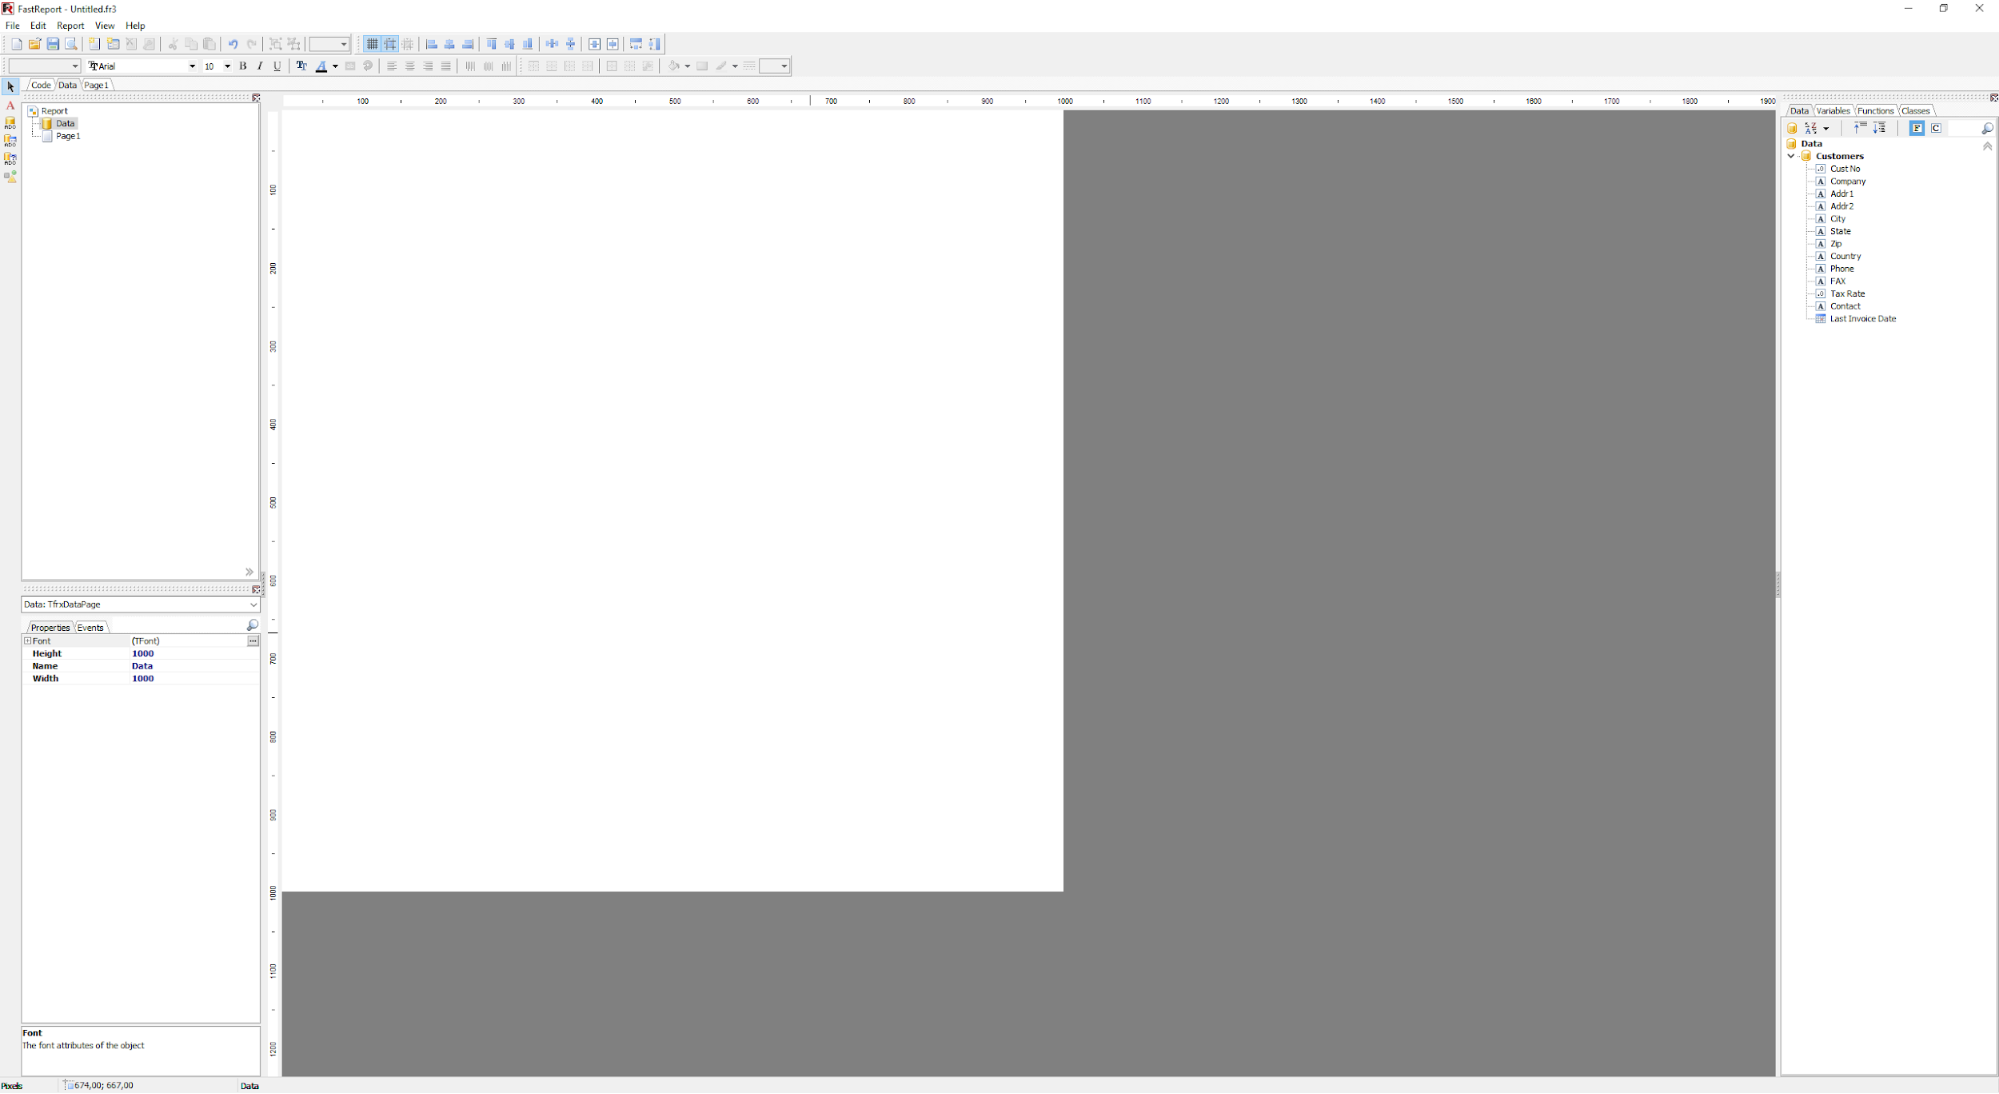
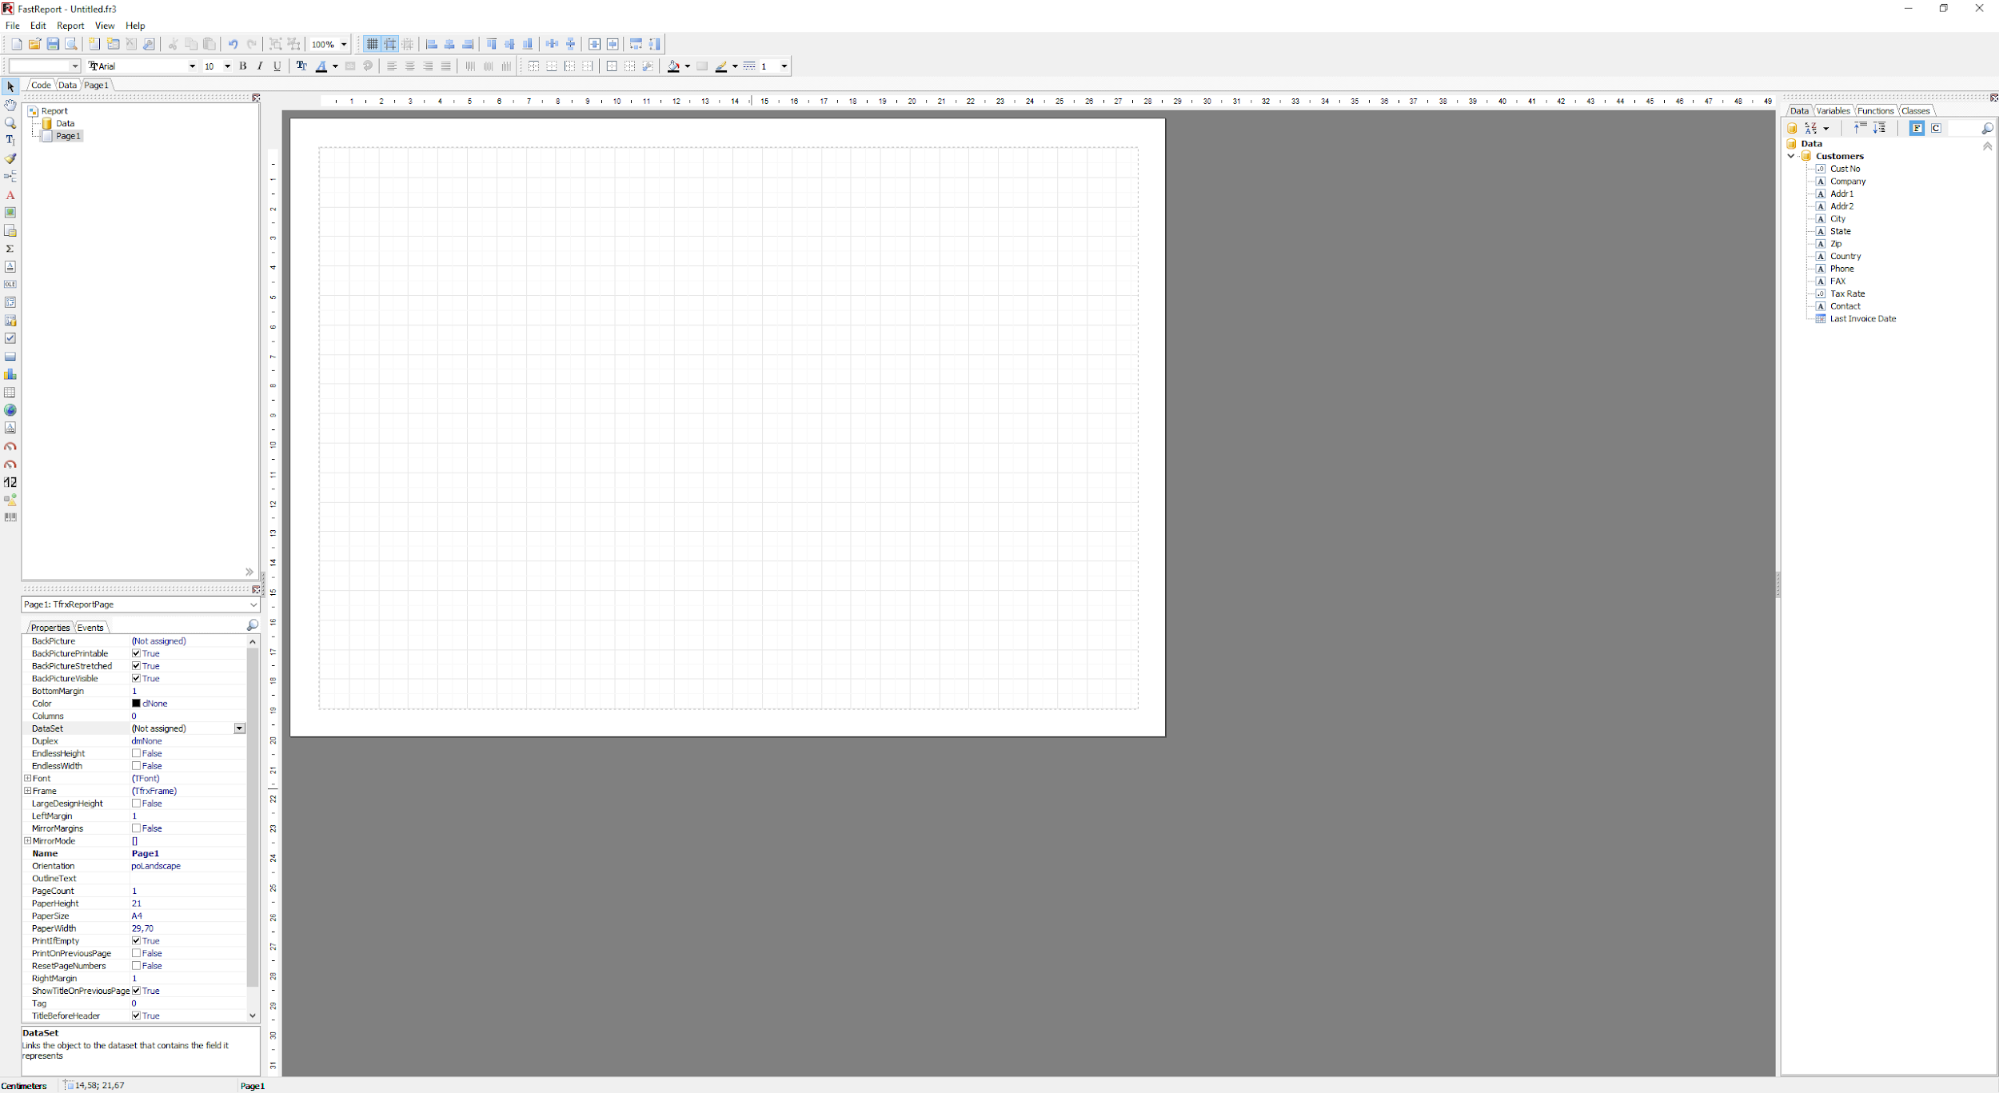
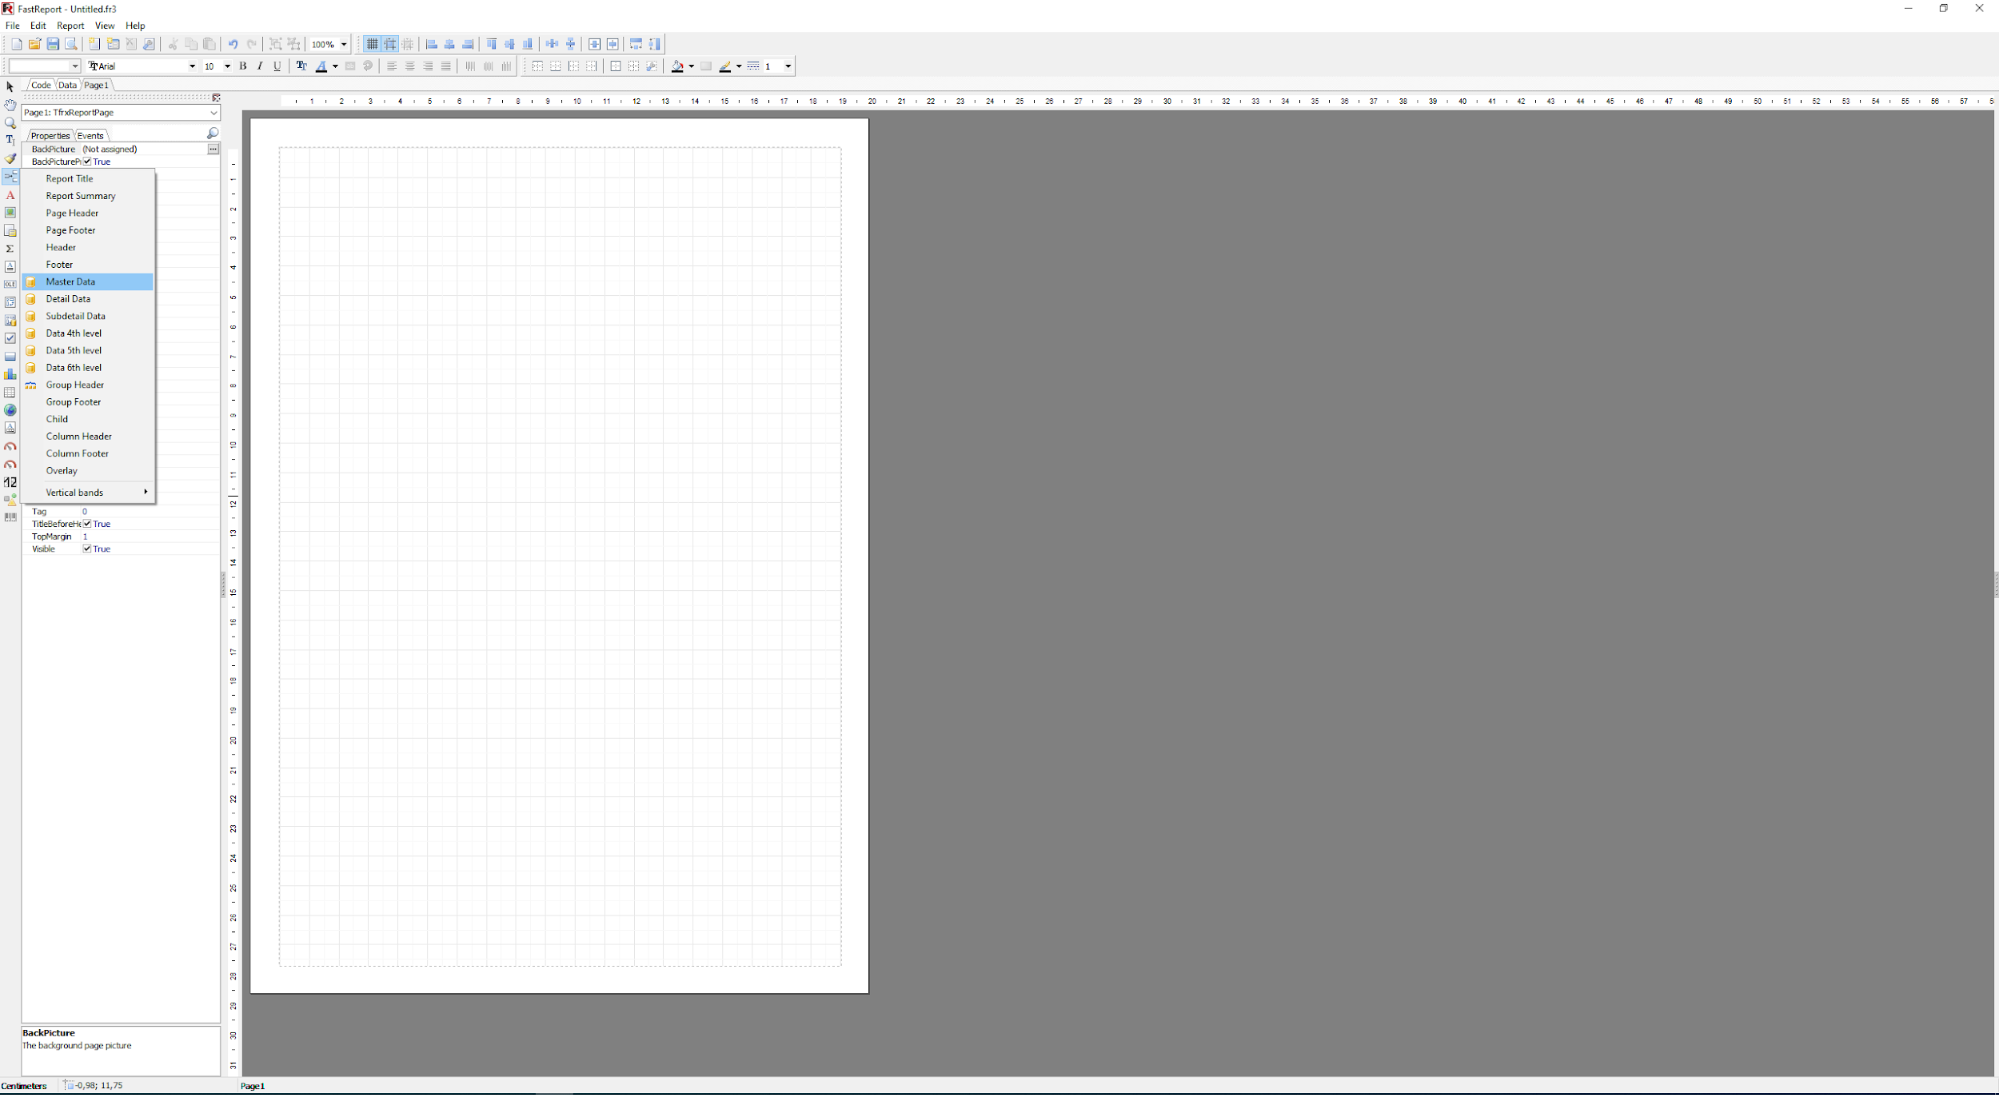
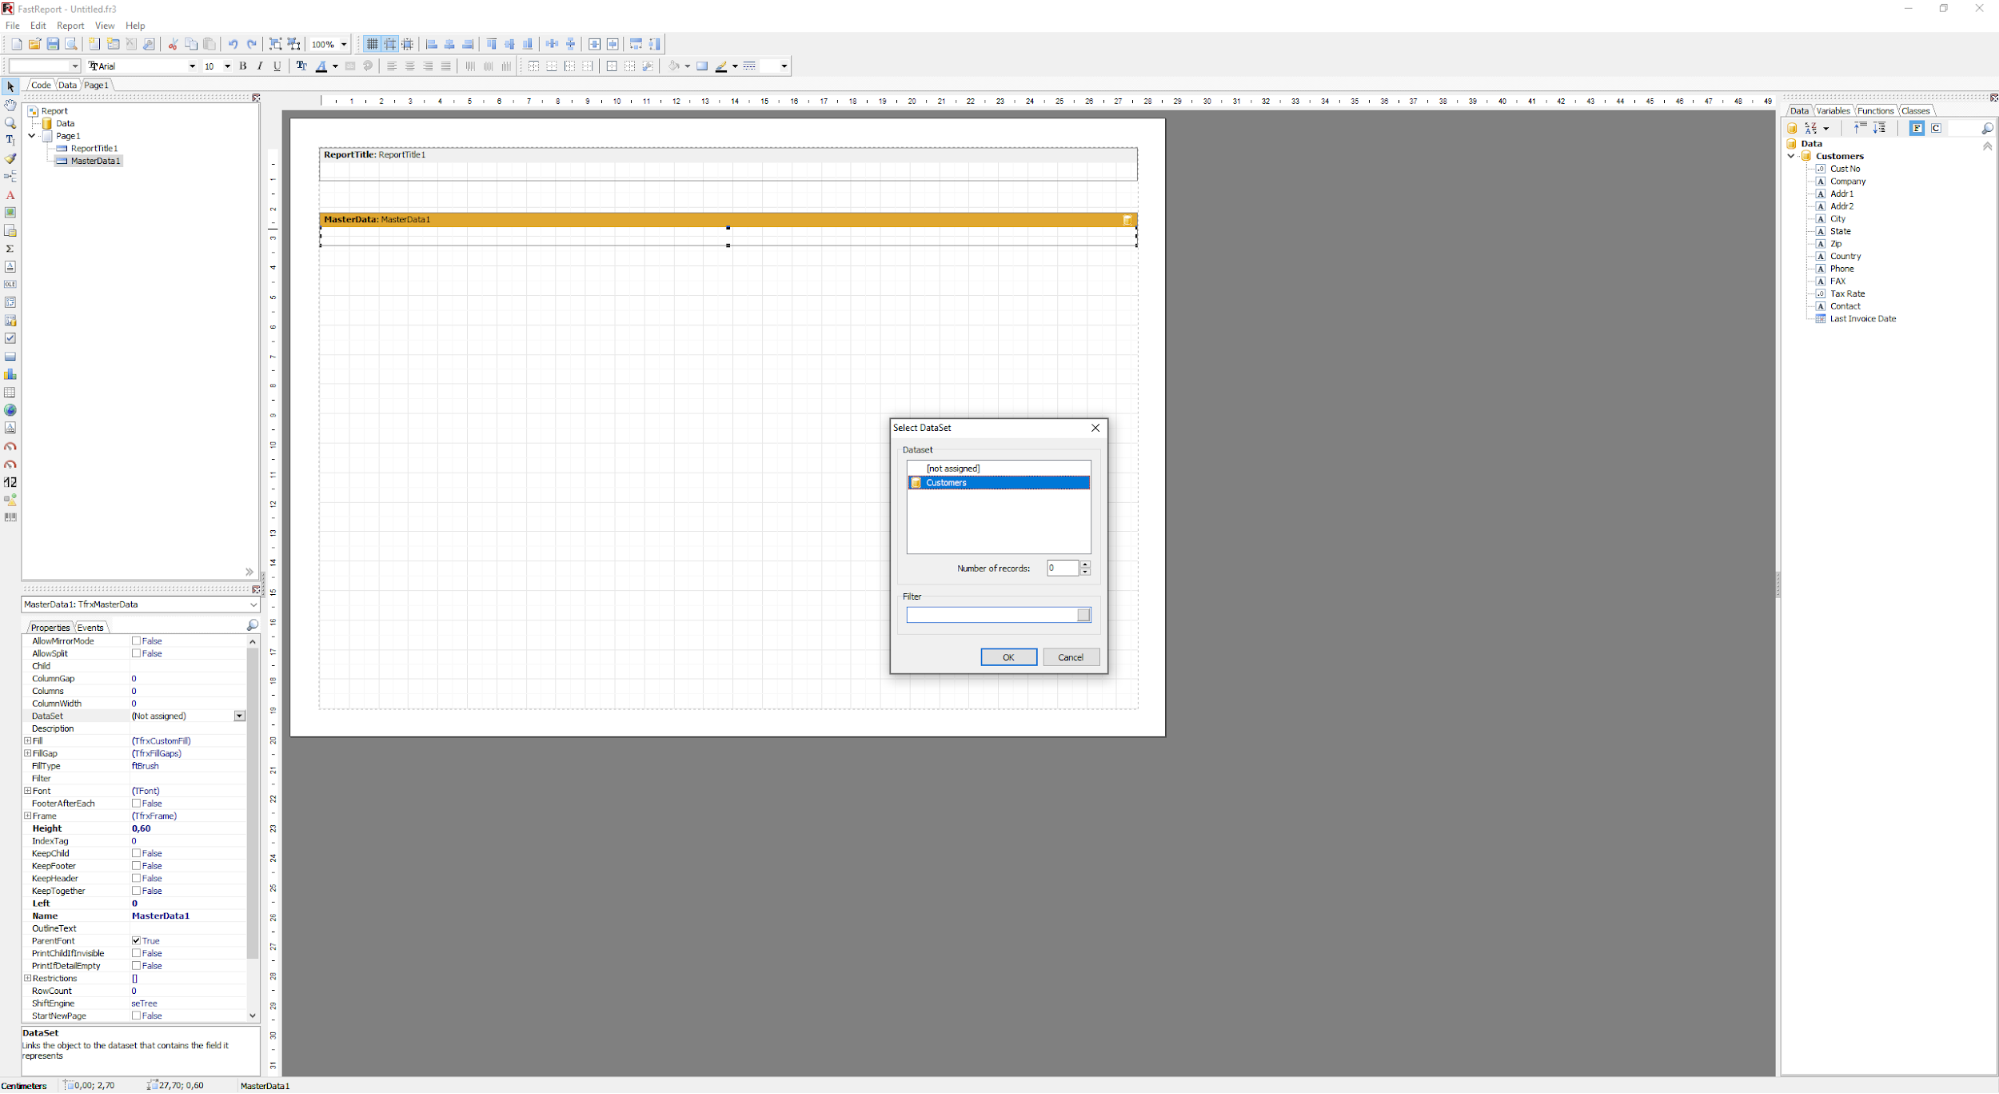
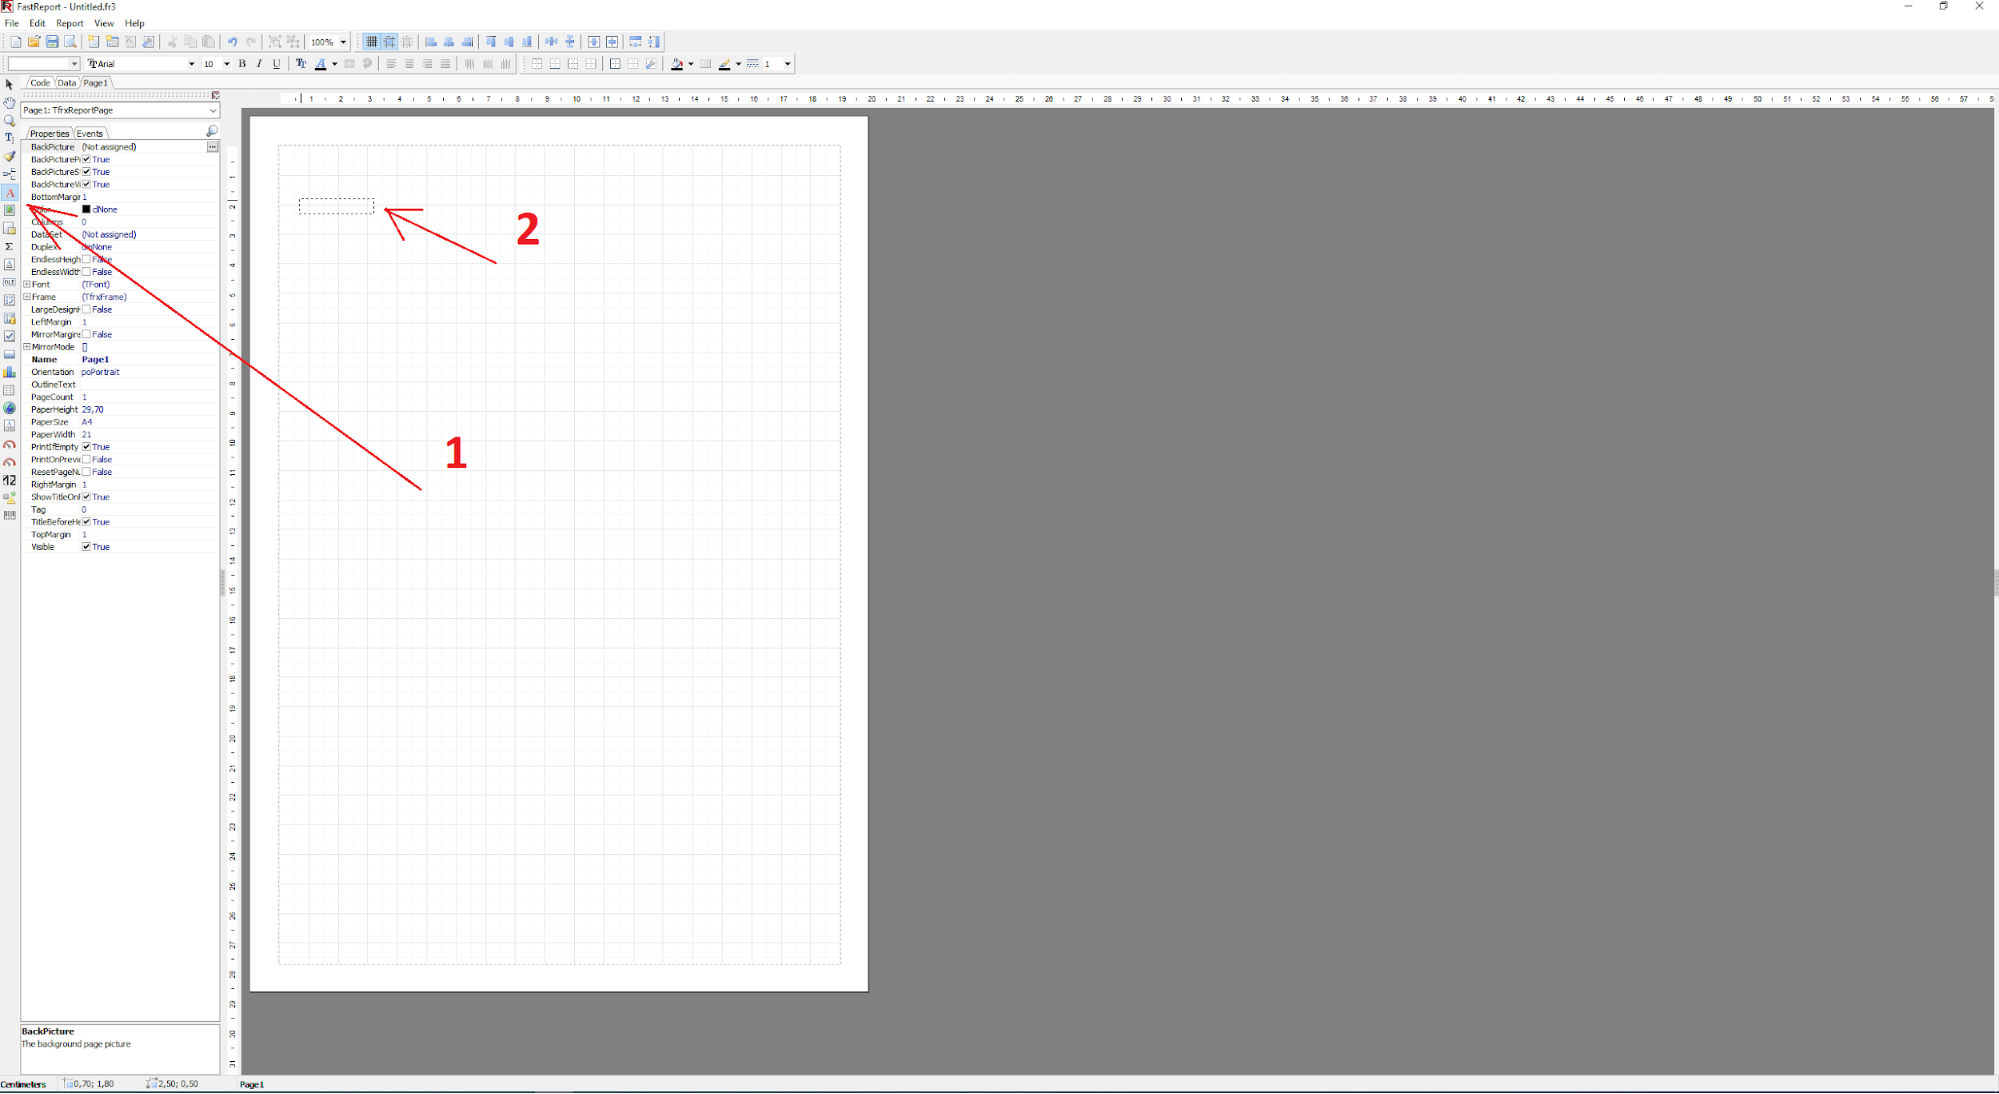
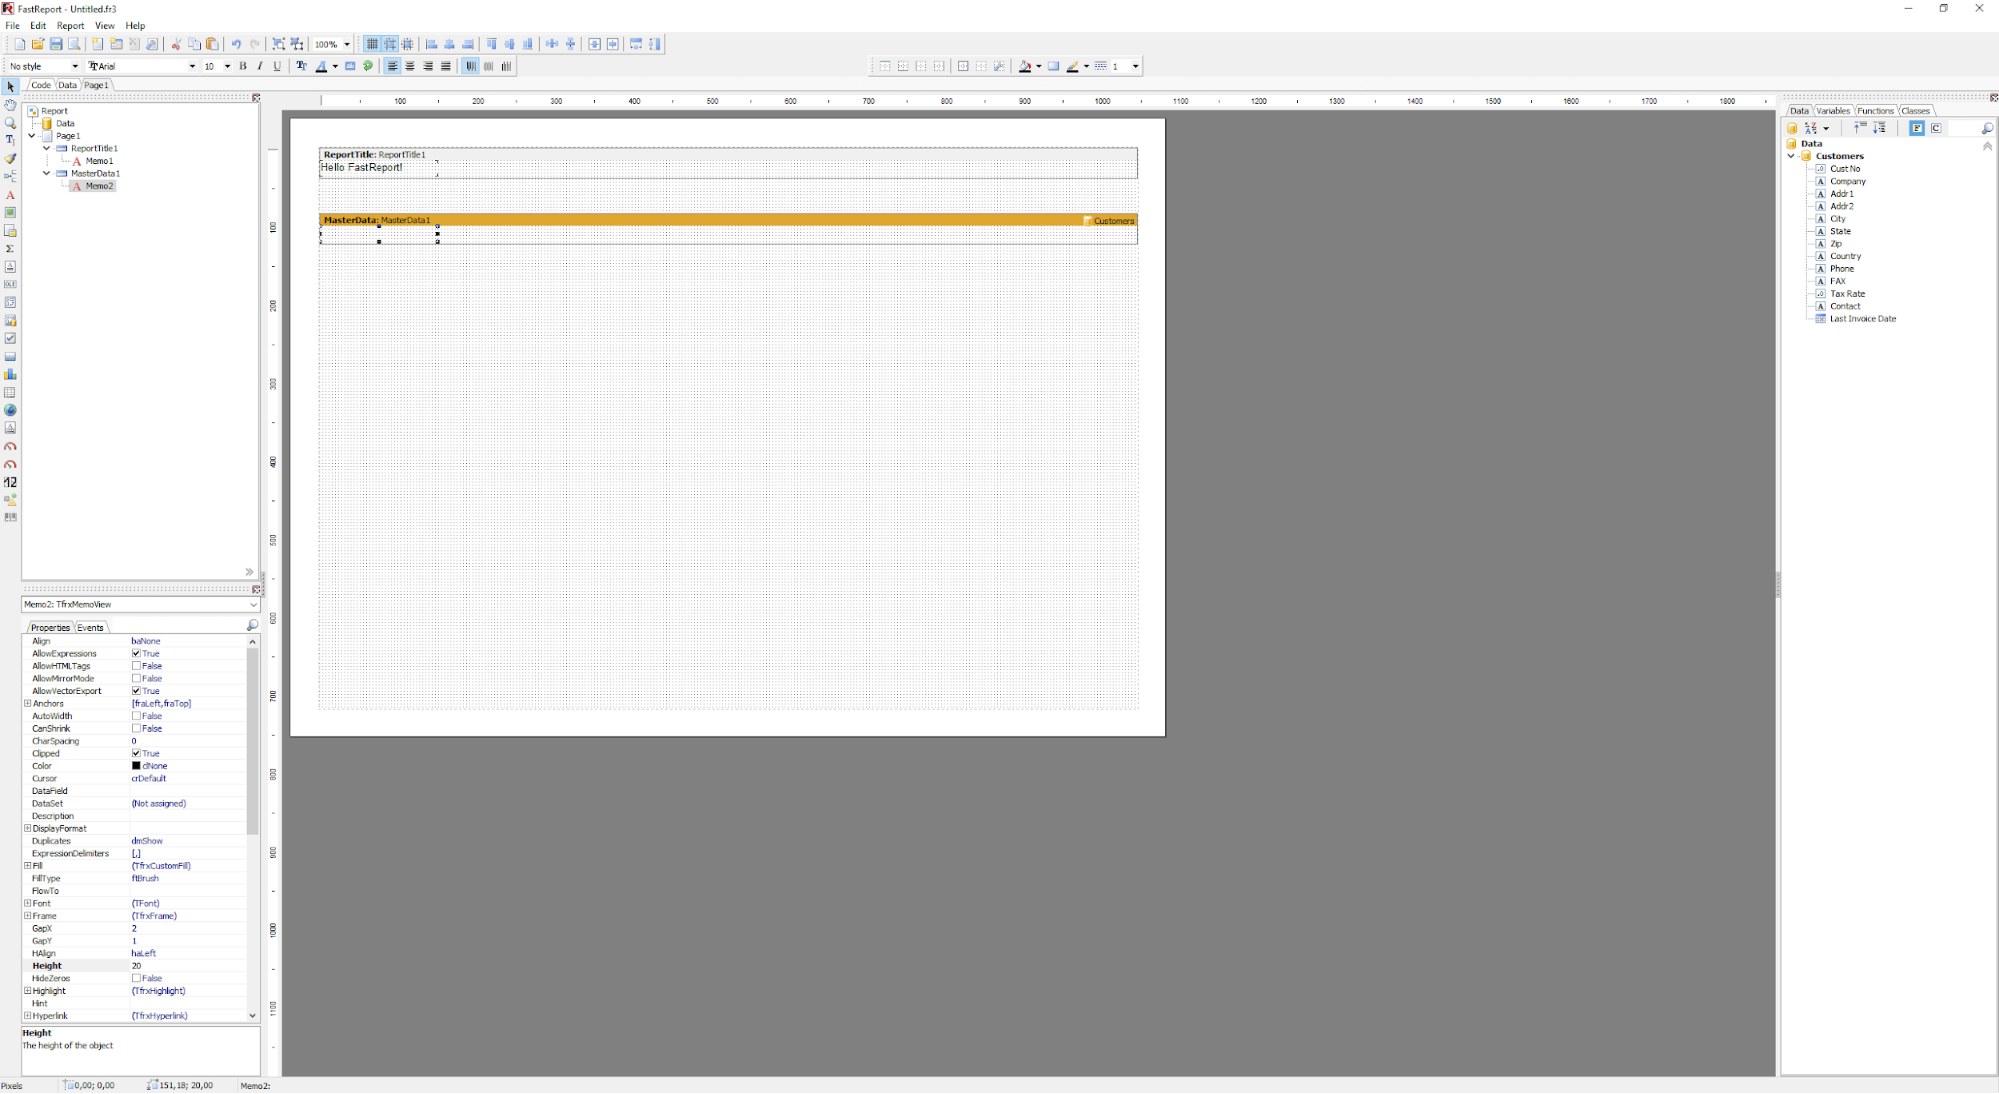
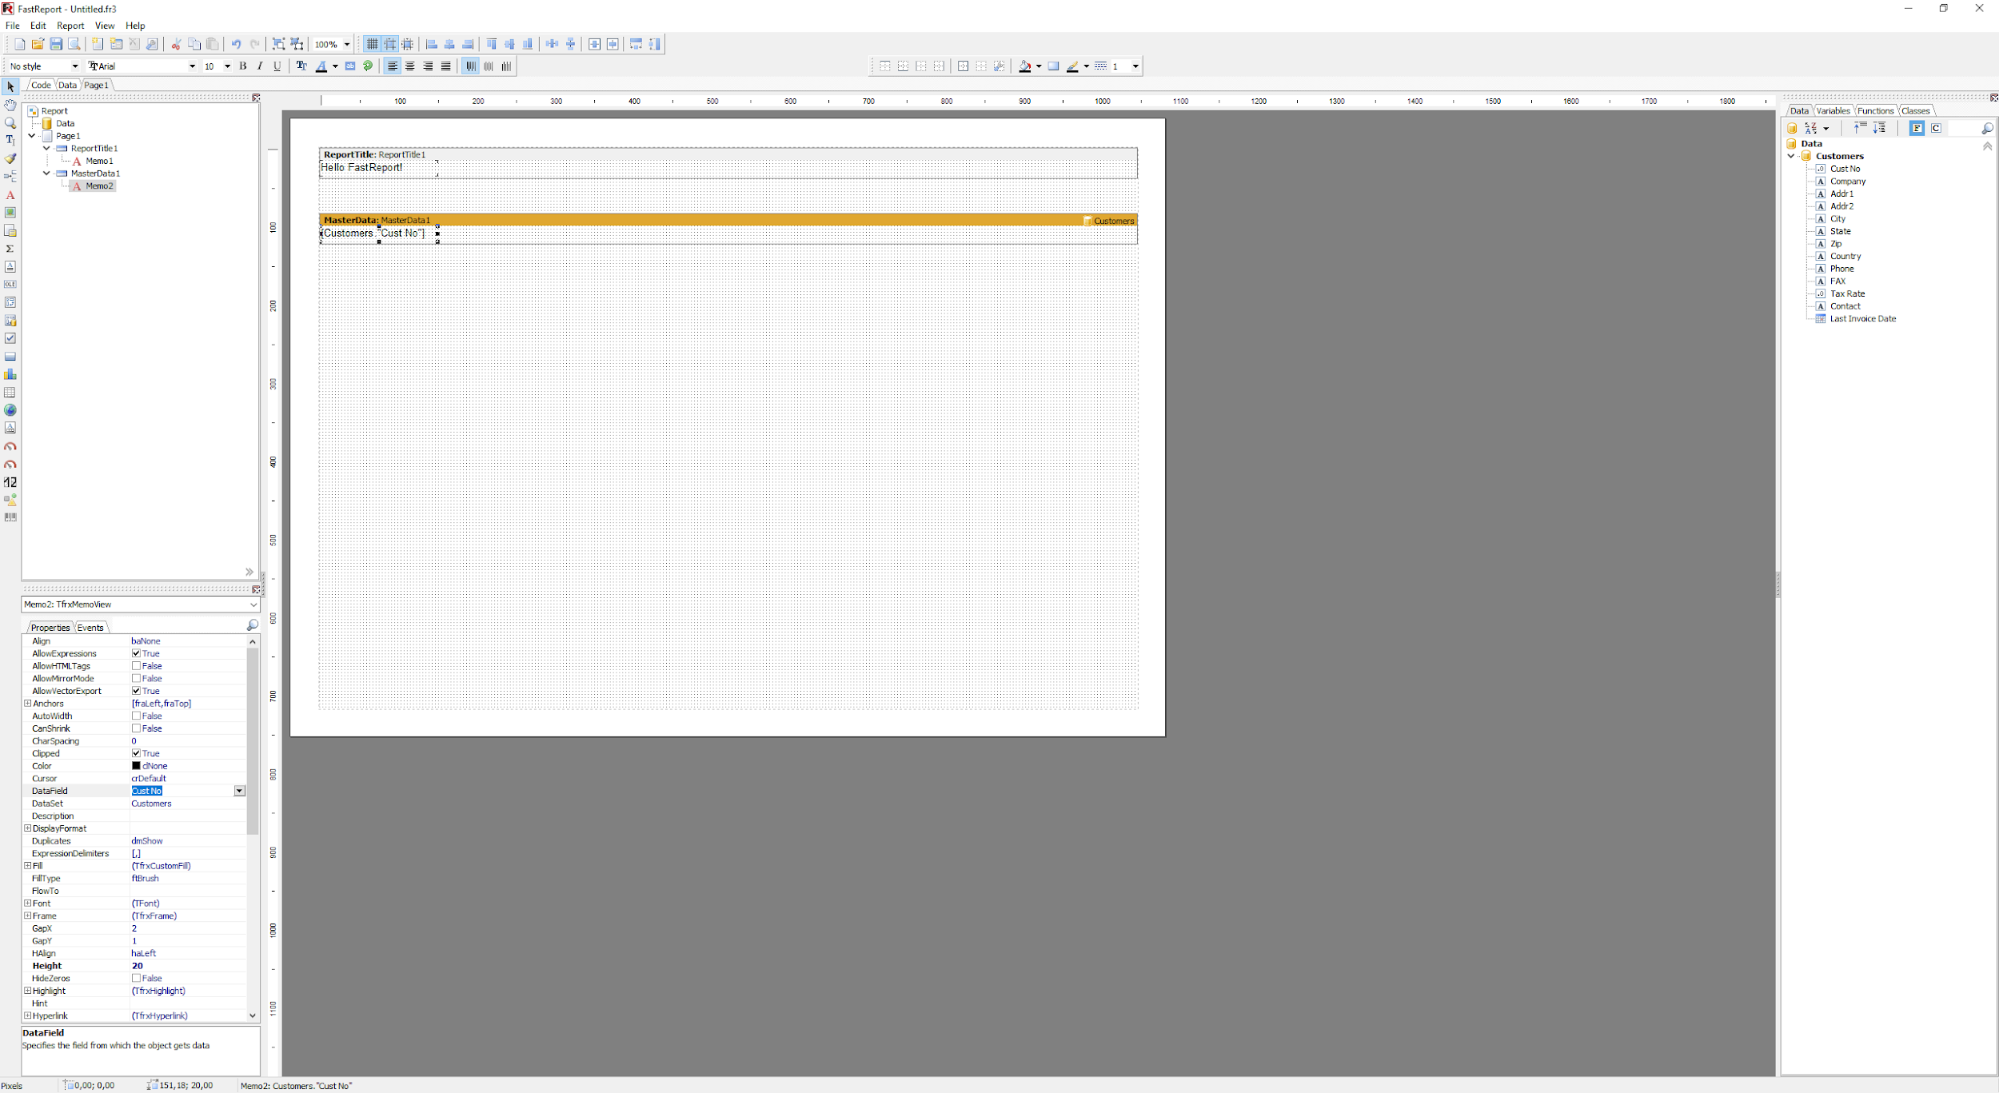
Connect this data source to the band. Select DataSet (table) in its properties. Now drag and drop table/request fields to the appropriate bands. After single dragging have peculiarity of automatic linking on band - fields of base.
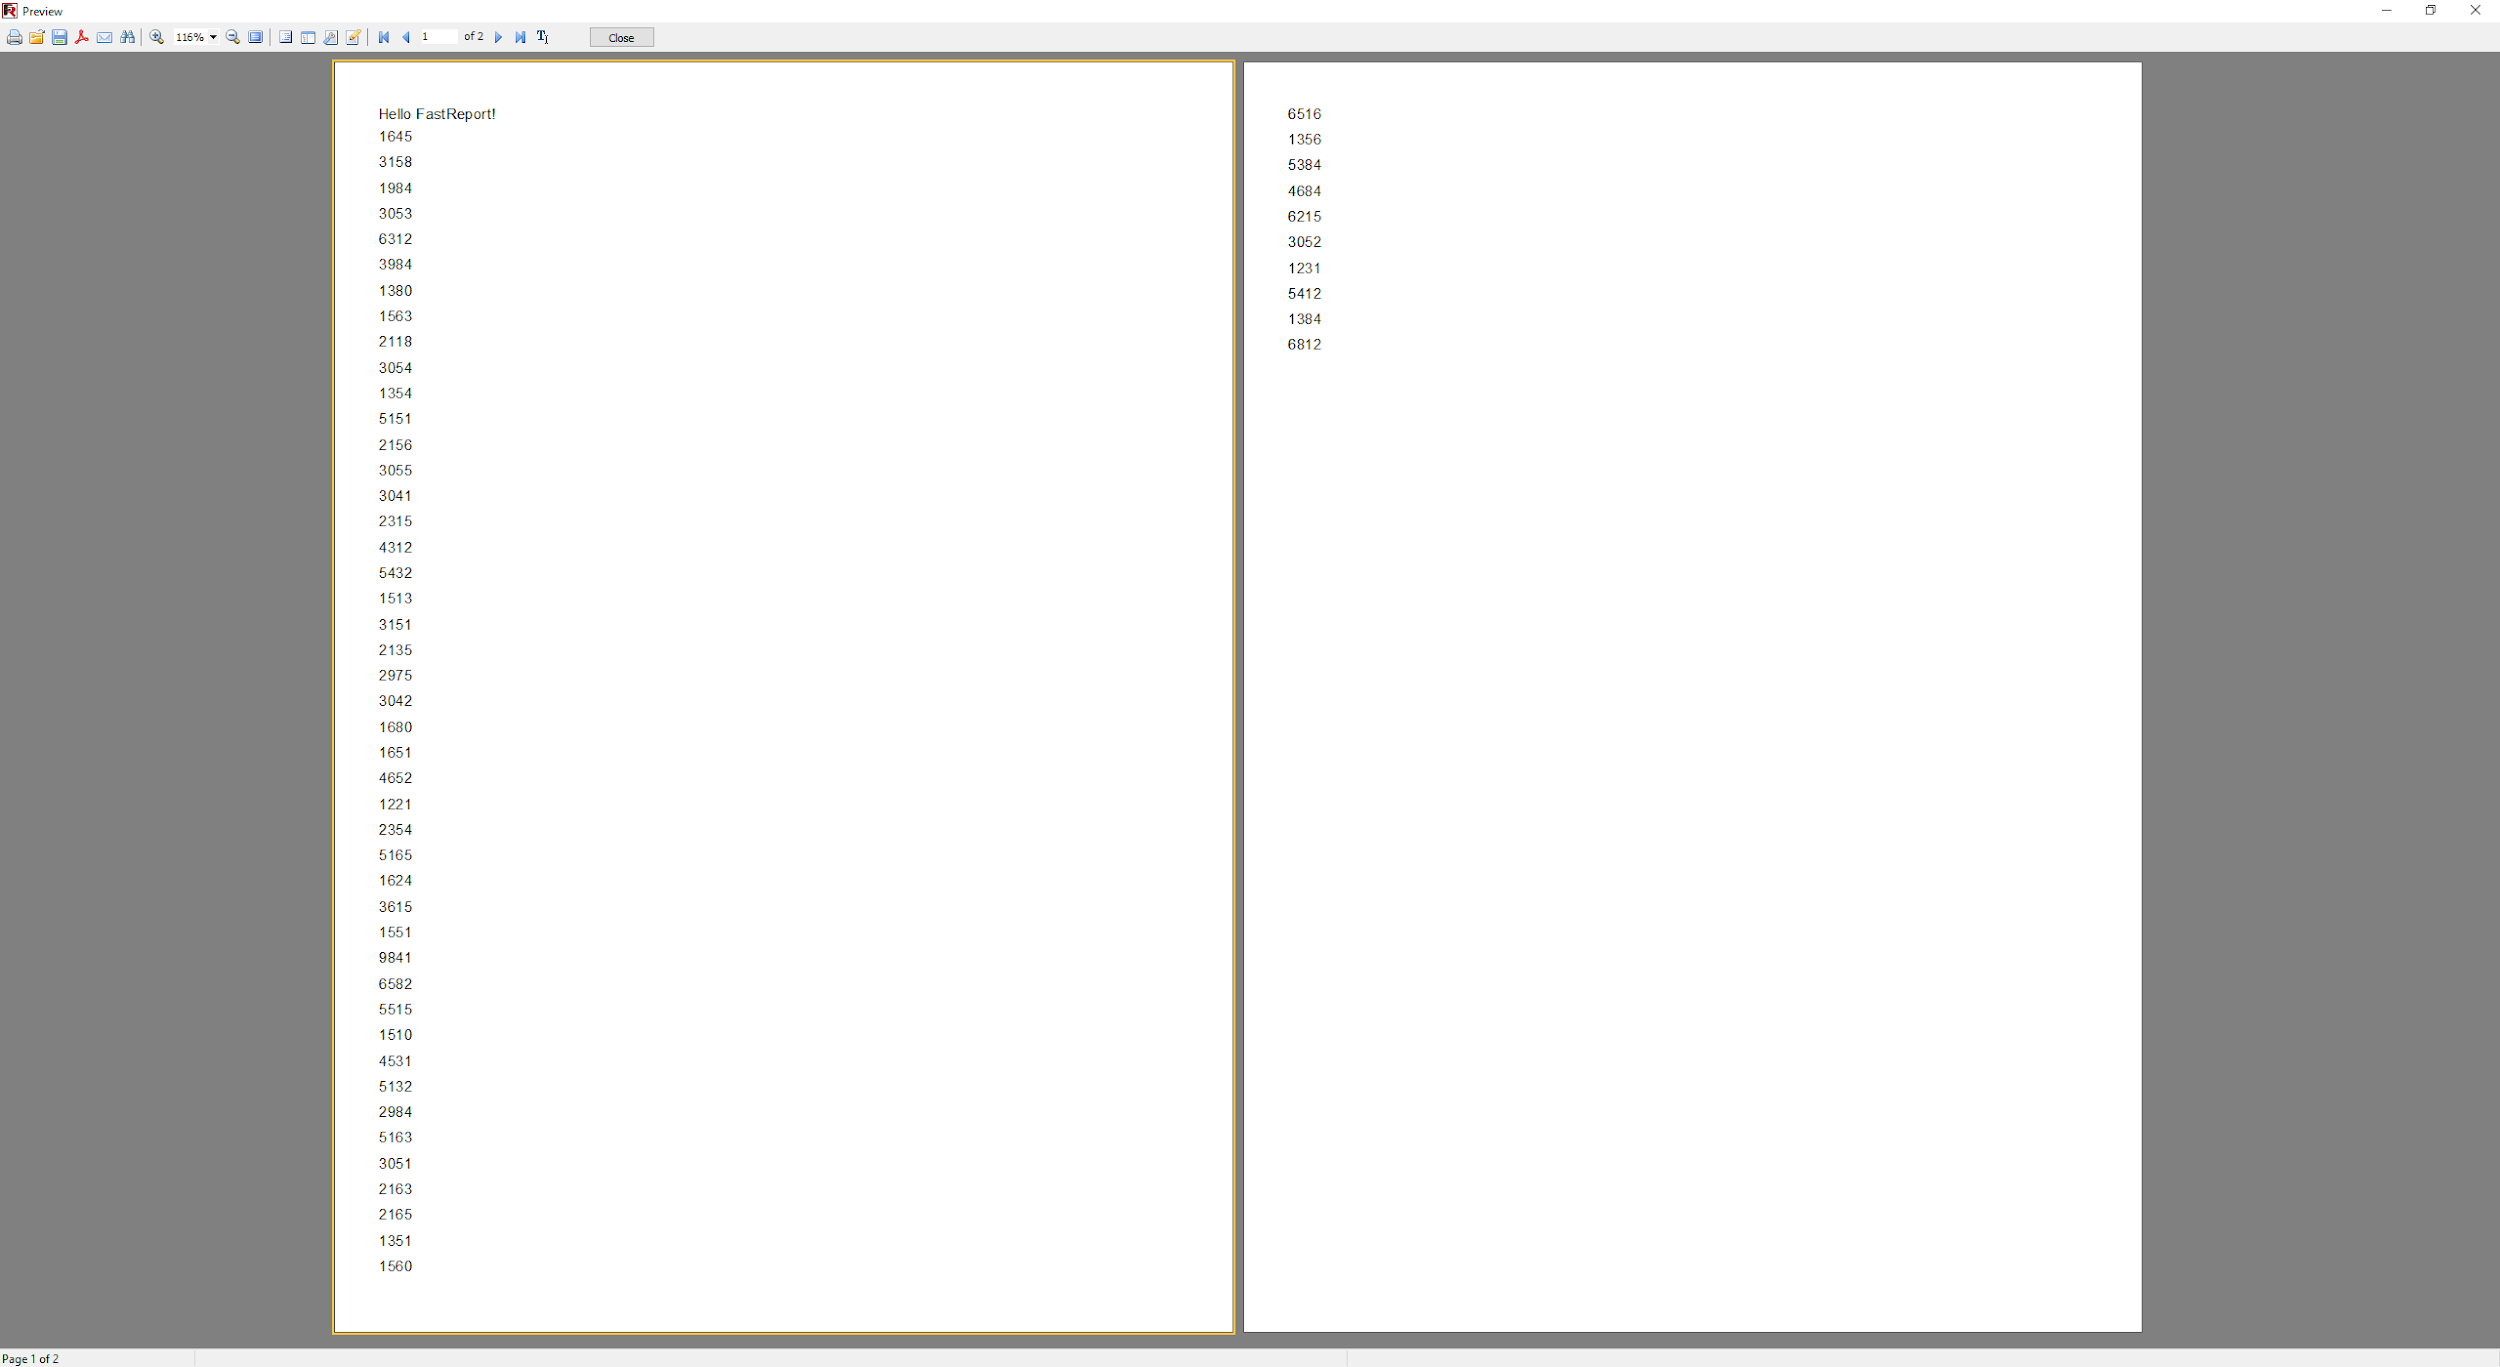
If you need to view the generated report, you can use the preview! Don't forget that you can add almost anything, be it QR codes, maps and other add-ons, which are enough in FastReport VCL.
Preview:
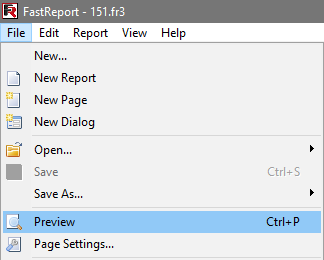
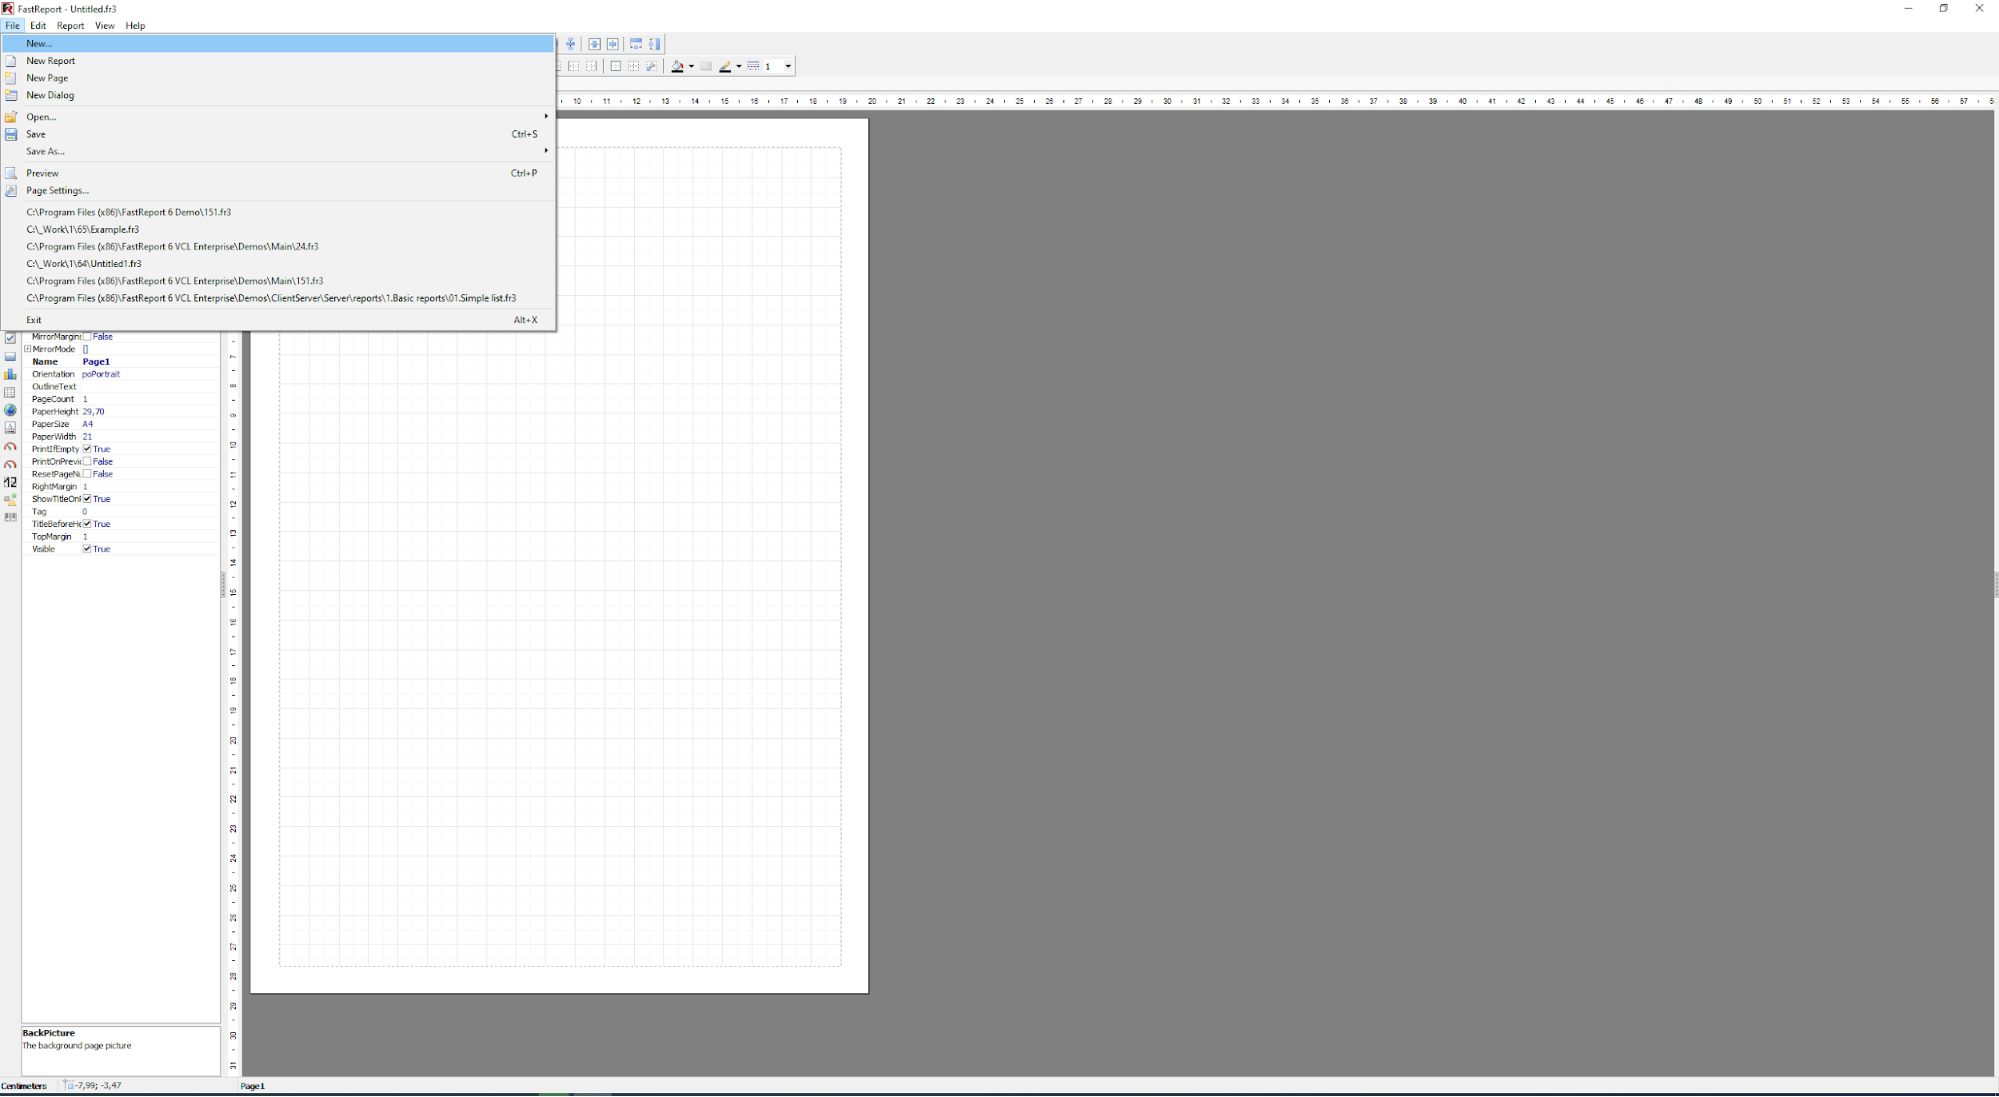
In the top left corner select “File” .
A list of settings appears immediately. In it, select "Preview".
That's it! After this action, you will see what the finished report will look like.
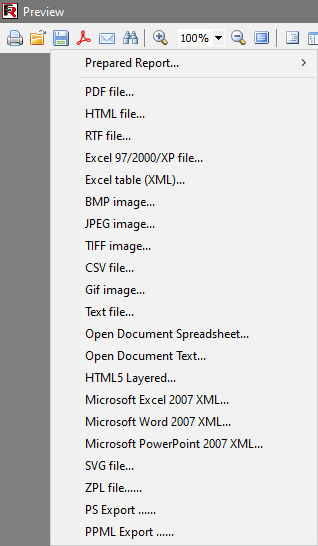
If you are satisfied, you can save to different formats and export to cloud storage or PC memory, as well as print.
Select "Save" and the desired format.
The selected one will be sent to the specified location for saving/export!
The following steps are required to generate a report from the code:
- clear the report.
- add data source.
- add “Data” page
- add report page.
- add bands on the page.
- set band properties and connect them to the data.
- add objects on every band.
- set object properties and connect them to the data.
Save the template and press “Preview”!
The report is ready! We can also save it in XML, PDF, even CSV or DBF for further analysis!
I understand that such an abundance of screenshots can make one get depressed. But in writing this article making all these screenshots was the longest and most time consuming task. Preparing the report itself took about 5 minutes. And if it is quicker and without screenshots?
Create a report from our database from Delphi / Lazarus - code!
Consider creating a simple "list" type report. Assume we have the components frxReport1: TfrxReport and frxDBDataSet1: TfrxDBDataSet (the latter is connected to data from DBDEMOS, table Customer.db). Our report will contain one page with report title and master data banks. The report title band will have an object with the text "Hello FastReport!" and the master data will have an object with a reference to the field "CustNo".
| Turn database data into a document in Delphi / Lazarus / C++ Builder | |
1 2 3 4 5 6 7 8 9 10 11 12 13 14 15 16 17 18 19 20 21 22 23 24 25 26 27 28 29 30 31 32 33 34 35 36 37 38 39 40 41 42 43 44 45 46 47 48 49 50 51 52 53 54 55 56 57 58 59 60 61 |
var DataPage: TfrxDataPage; Page: TfrxReportPage; Band: TfrxBand; DataBand: TfrxMasterData; Memo: TfrxMemoView; { Clear the report } frxReport1.Clear; { add data source to the available list for the report } frxReport1.DataSets.Add(frxDBDataSet1); { add “data” page } DataPage := TfrxDataPage.Create(frxReport1); { add page } Page := TfrxReportPage.Create(frxReport1); { create unique name } Page.CreateUniqueName; { set page properties by default } Page.SetDefaults; { change page orientation } Page.Orientation := poLandscape; { add report title } Band := TfrxReportTitle.Create(Page); Band.CreateUniqueName; { it’e enough for a band to set coordinate Top and hight } { both coordinates are in pixels } Band.Top := 0; Band.Height := 20; { add object on report title } Memo := TfrxMemoView.Create(Band); Memo.CreateUniqueName; Memo.Text := 'Hello FastReport!'; Memo.Height := 20; { this object will be aligned with the band width } Memo.Align := baWidth; { add master data } DataBand := TfrxMasterData.Create(Page); DataBand.CreateUniqueName; DataBand.DataSet := frxDBDataSet1; { coordinate Top shouldn’t cross the previous band! } DataBand.Top := 100; DataBand.Height := 20; { add object on master data } Memo := TfrxMemoView.Create(DataBand); Memo.CreateUniqueName; { connect to data } Memo.DataSet := frxDBDataSet1; Memo.DataField := 'CustNo'; Memo.SetBounds(0, 0, 100, 20); { align text on the right side of the object } Memo.HAlign := haRight; { show the report } frxReport1.ShowReport; |
So - we have learned how to turn invisible but collected data into reports - documents. You can now publish them or pass them on to analysts!
