Global update of the FastCube VCL OLAP library
I. Grids
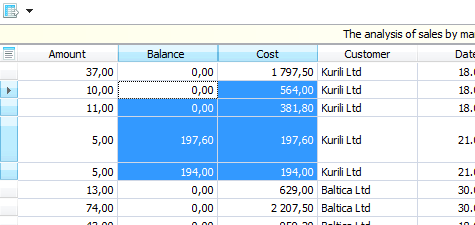
1. Improvements to source data grid
This screenshot shows that the cube grid has a title zone and active row marker and also supports resizing and cell selection for clipboard operations.
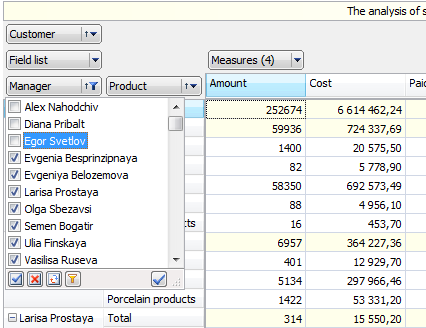
2. Closer to the native look of Windows with enabled themes
This screenshot shows the improved appearance of the grid. Note that dropdowns are now consistent with other Windows controls.
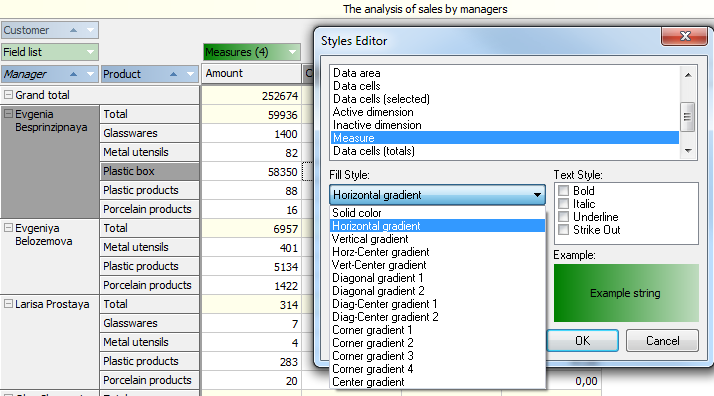
3. Gradient drawing
It is now possible to use a variety of gradient fills, as well as solid fills, for various parts of the grid.
II. Data analysis
1. Optimized axis operations
- Grid transposition is now instant – it does not require data recalculation (required in FastCube1)
- Movement of Measures between axes and within an axis is now instant – it does not require recalculation (required in FastCube1)
- Filtering does not reset the state of collapsed nodes
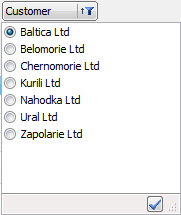
2. New dimension attribute for single choice (radio filter)
It is now possible to set up a dimension having a single value, if required. This screenshot shows how it appears in the grid.
3. Groups
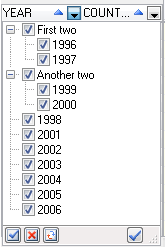
FastCube2 can now merge the dimension items into groups. For example you can place the first two years in one group and the next two in another group. This is how it appears in the dropdown:
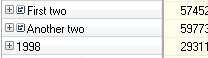
And the grid axis appears as:
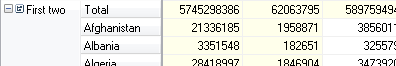
Note the new button with a “tree” icon near the regular expand/collapse button. When you have a group you can expand it as a regular dimension item (using the regular expand/collapse button). So you will see the aggregate values for 2 years as:
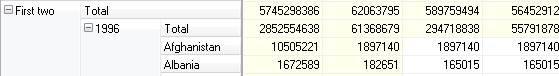
Or you can expand the group itself using the new “tree” button.
4. Totals
Totals have many new features. This screenshot shows some of them.
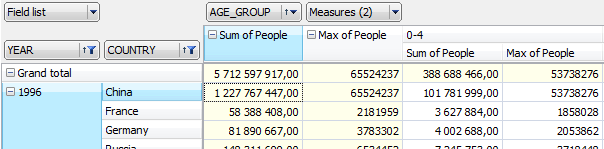
- One measure can have more than one total
- Each total has a position attribute which allows it to be placed either before items, after items or nowhere
- Total can have its own aggregate function which differs from the measure aggregate function
- Grand total can be collapsed (it collapses the whole axis)
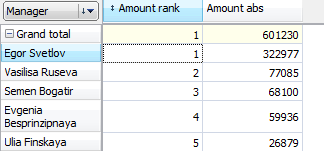
5. Ranks for measures
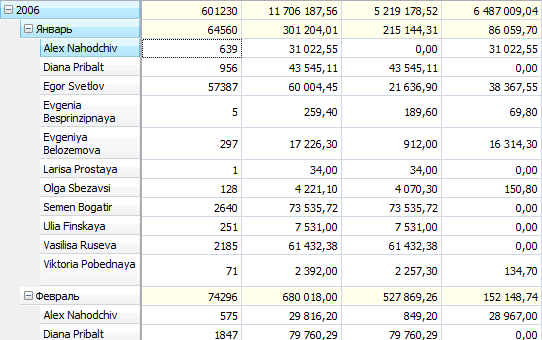
6. Tree-like axis
The grid can now represent axes in a more compact form, as in this screenshot.
7. Data highlighting
Data highlighting has been significantly improved.
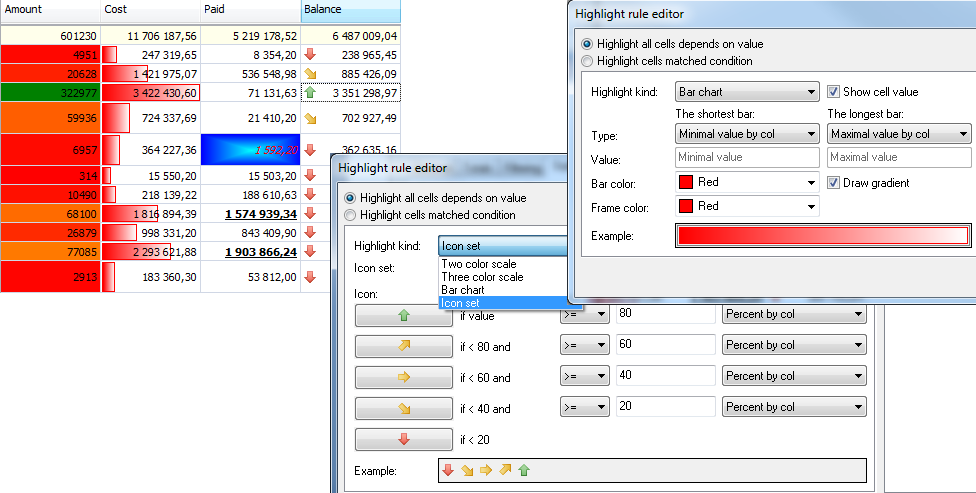
It is now possible to highlight any cell dependent on its value, in addition to the existing conditional highlighting of cells (which itself has also been improved).
8. Status panel
FastCube2 grid has a status panel which shows aggregates for a selected region.
9. Use of FastScript
Although FastCube2 uses the same scripting engine as FastCube1 we have been able to improve its use in several ways. Whereas FastCube1 restricted the script space to individual calculated measures, so preventing the sharing of code with other measures, FastCube2 now has a script space common to all calculated measures, thus making it possible to share some code between them.
10. Export
FastCube2 comes with built-in support for exporting both slice and cube data to these data formats: XLS, HTML, DBF (cube data only), ODT and XML.
III. Cube
1. Splits
FastCube2 supports these types of field splits:
- Split date and time fields into their component parts (day, month, minute, …). The parts required can be specified before the data load. Moreover, parts can be added or removed even after the data load
- References: additional fields can be loaded from reference tables based on a key field
- Custom split: a custom field can be created, based on any other field, and can be loaded in the code, using values from the base field.
2. Loading from custom storage
There is a new component, similar to the FastReport user dataset, which allows data loading from sources other than TDataSet. Field descriptions need to be written and also handlers for traversing the data store and retrieving the data.
3. Data conversion during the load process
If a data table stores numerical data in a string field it is only required to specify the result type and the data loader will automatically convert values during the load process.
4. Custom field calculation during the load process
For complex data transformations it is possible to create a user field which is evaluated during the load process. The evaluation can be performed using an embedded script or by means of an event handler.
5. Add/remove operations on fields after the load
FastCube2 allows these field operations after the data load:
-
Remove a field
-
Add custom calculated fields
-
Change split parts for date and time fields (see above)
-
Create custom splits
6. Append data to an active cube
FastCube2 allows the loading of additional data to already opened cubes.
IV. Global filter
FastCube2 has a new standalone component which allows a single data cube to simultaneously analyse data using different criteria provided by independent filters.
V. More to come
Other features that will be implemented in future FastCube2.x versions include: hierarchical dimensions, top-N, vertical text output, export to more data formats … and more.