Vector barcodes and SVG in PDF, HTML and SVG export
FastReport 2018.2 has support for vector graphics in exports.
Now some barcodes and SVG images are exported in vector form. This applies to exports to PDF, HTML and SVG. As for barcodes, the explanation is needed to be given - only linear bar codes can be exported as vector images.
In the current version of 2018.2.22, a special tab of the settings for vector images - "Vector Graphics" has been added in the PDF export settings window.
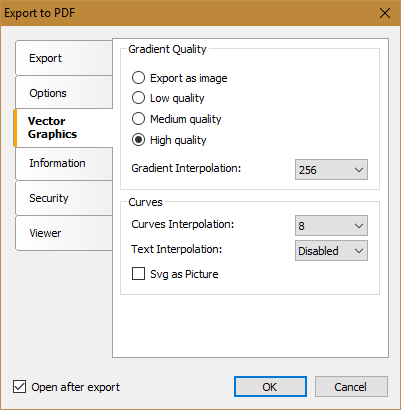
Here we have two types of settings - the gradient quality and the curves. The quality of the gradient affects the smoothness of the transition, i.e. number of shades. A gradient interpolation determines the dimensionality of the gradient at the points.
Interpolation of curves allows you to plot curves with a given number of segments. Rather, we specify the number of points that will be used to create the segments. Interpolation makes the curve more rounded. The higher the interpolation, the more rounded the curve is obtained.
Some PDF readers of older versions had problems with displaying vector graphics. Therefore FastReport has developed its own curve builder. If you turn off the interpolation option, the PDF reader will choose how to build the curve.
Let's look at the gradient settings.
Gradients in PDF are generated on a grid of gradients, i.e. the grid is generated, grid colors are computed on the grid nodes, and then a complex gradient is created. The quality of the gradient affects the size of the grid that will be generated. The higher the quality of the gradient, the more accurately this grid will be generated. However, the speed of the image creation will suffer.
Interpolation of the gradient shows what size of the grid will be used in PDF, the higher the value, the more beautiful, but more space will be occupied on the disk.
This is how the gradient looks if you set a low quality and interpolate 256:

And now, high quality and interpolation 256.

The difference is almost invisible to the eye, but it is there. This difference is better seen on complex gradients. For example, low quality:
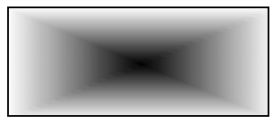
High quality:
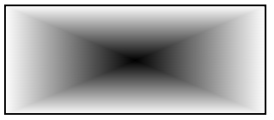
Here all the questions disappear by themselves.
But if you change the value of gradient interpolation to minimum, the difference is immediately noticeable with the usual linear gradient. For example, the interpolation value of 2:

And the interpolation value is 16:

Now consider how interpolation of curves works. For example, we have an SVG image - the circle. Which is implemented using the tag <circle />:
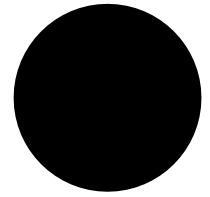
And we want it to be rendered using 8 segments. We set the value 8 to interpolate the curves:
The larger the interpolation value, the more rounded the curve we get. For example, with a strong approximation of the circle, you can see this:

It is seen that the circle is not at all perfectly round, it consists of many segments.
What about the interpolation of the text? Here the situation is exactly the same as with the curves. After all, symbols also consist of curves. Hence, the greater the value of the interpolation of the text - the more "qualitatively" it looks.
And then you can ask: "Why do you need these settings? Obviously, you need to use the maximum settings to get a high-quality image. " Yes it is.
But the high settings noticeably increase the size of the resulting file. If you do not need the maximum quality of gradients and curves, you can sacrifice them to reduce the size of the document and increase the speed of its creation.
At first glance, the new options seem to be of little use to ordinary users, but they will be appreciated by those who work with vector graphics. FastReport offered its SVG image renderer, because some PDF viewers incorrectly display them. It's nice that the manufacturer cares about us, trying to foresee all possible problems.