FastReport .NET report types
In this article we are going to demonstrate the types of reports, that we can create in FastReport .NET. An inexperienced user of our report generator might think that the reports are only lists or grouped lists. However, the capabilities of the report generator are much wider than just displaying some lists of data. Due to the built-in script and dialog forms, reports can have logic. Charts and embedded maps allow you to transfer your reports from simple accounting to an information-cognitive area.
Here is a list of report types:
1) Simple list;
2) Master-Detail;
3) Master - Master;
4) Report with grouping;
5) Label;
6) Multi-column report;
7) "Booklet" report;
8) Subreport report;
9) Inherited report;
10) Report with a chart;
11) Report with cards;
12) Matrix report;
13) Report with a dialogue form;
14) Report with the script;
15) Interactive report.
But first things first. So, the first type of report:
1) Simple list. provides simple displaying of data from a database table in one list like a page in Excel. It can be only one table or data from key-linked tables, but they are displayed in one data band. For example:
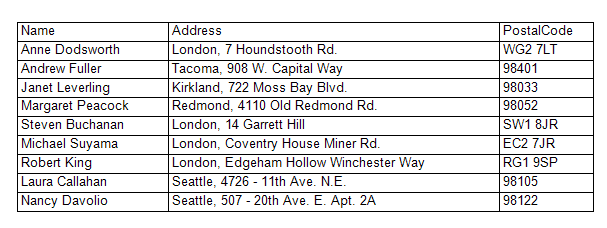
Or like this:

In the example, we have just arranged the fields from the data source vertically.
This type is the most common because it is simple and quick at creating reports.
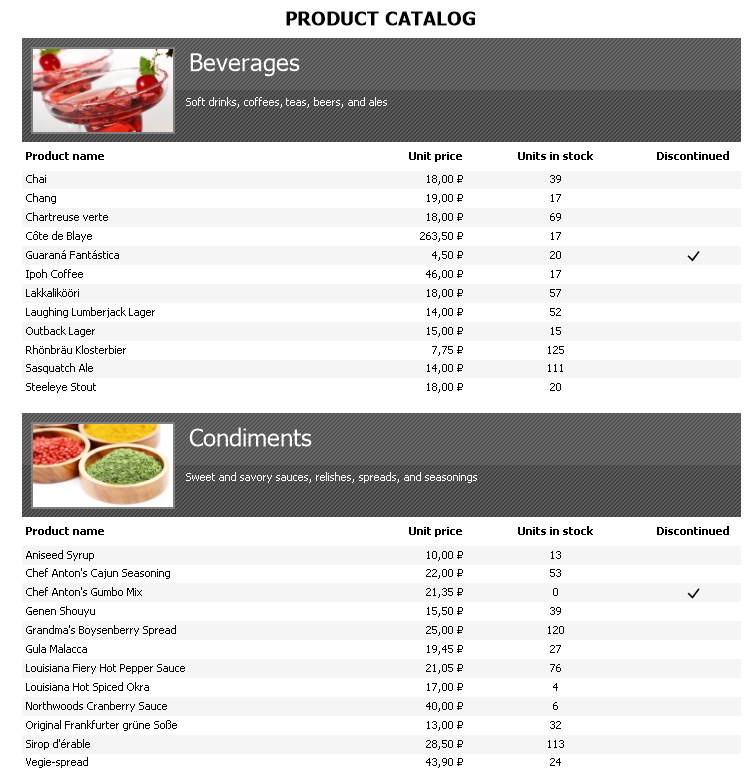
2) When we need to output data from different tables, linked by a key, we can use the Master-Detail type. Here, the data for each table is output in different Data bands. However, there is only one main band and there is its subordinate band. This means that for each record in the main band, all records ,corresponding to the key in the subordinate band, will be displayed. Using this way it is convenient to display, for example, categories of goods with lists of goods:
3) Master - Master. In the previous example, we used two Data bands. One of which depended on the other one. A report like "Master - Master" also uses several Data bands, but they are not connected and do not depend on each other. In fact, they are several separate lists, which are displayed sequentially.
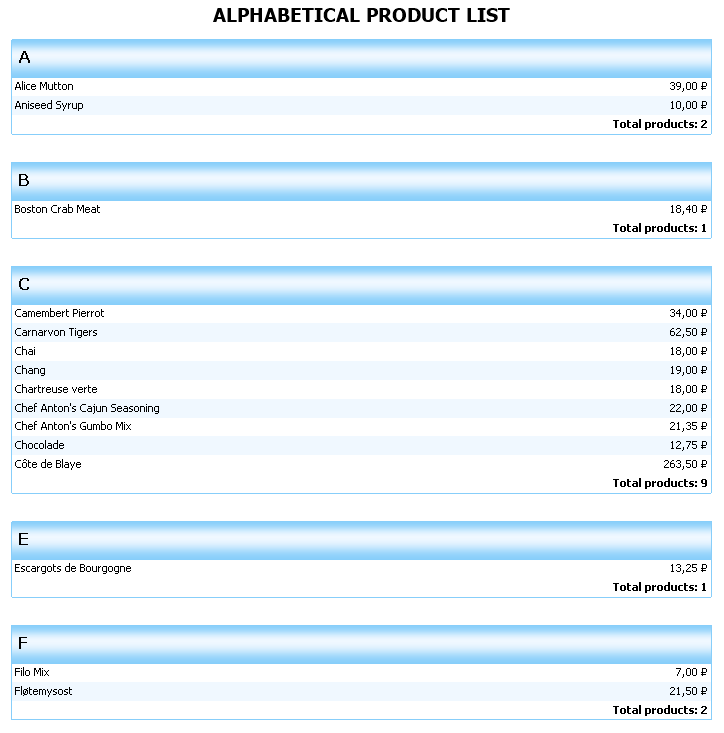
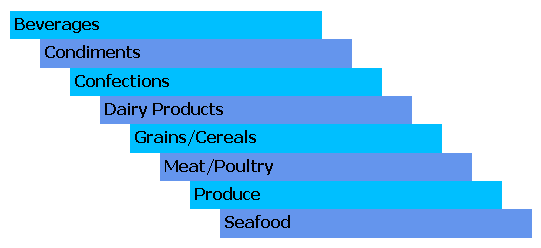
4) Report with grouping. It is clear from the name of the type, that here we speak about grouping of data according to all given conditions. For example, grouping by the first letter of the product name:
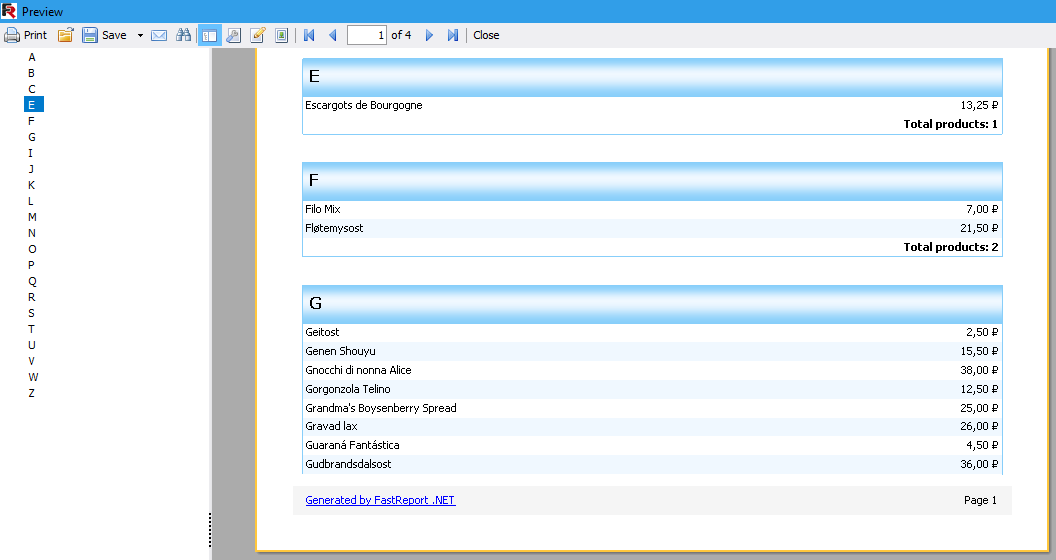
As a result, we have a visual list with a division into groups. There and then, you can organize a report outline, where groups will be displayed. When selecting groups in the report outline, you will be moved to the corresponding group in the report:
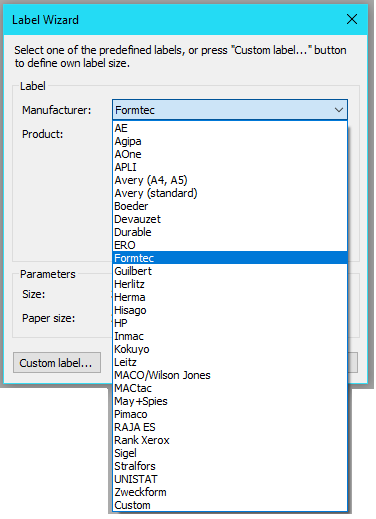
5) Report "Label". It allows you to use the label templates. There is a set of built-in label templates from different manufacturers:
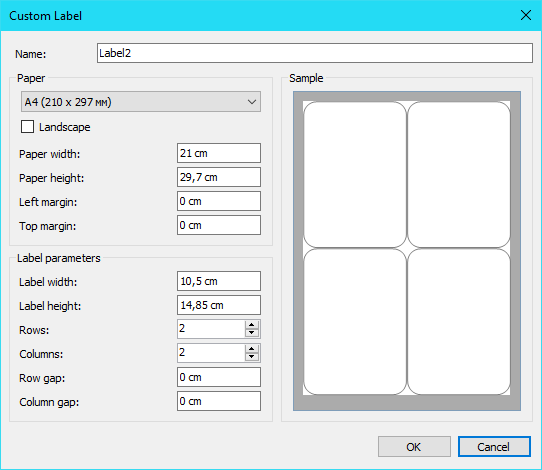
You can also create your own template, in which you will specify the size of the label and the number of labels on the page:
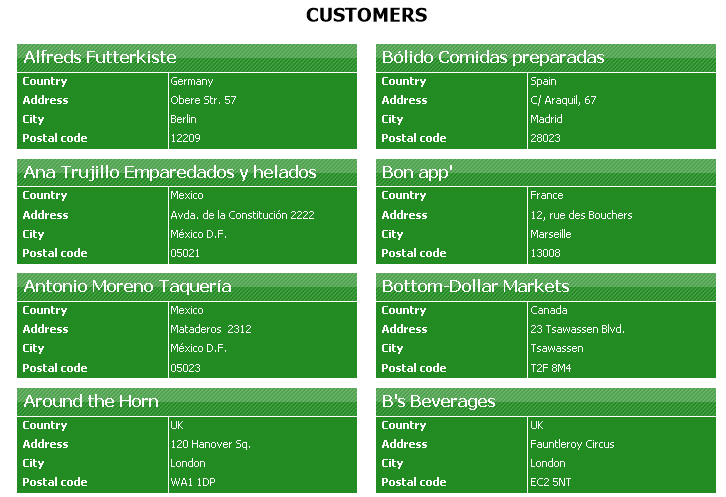
This way you can create labels of the right size. Let us take a look at the example:
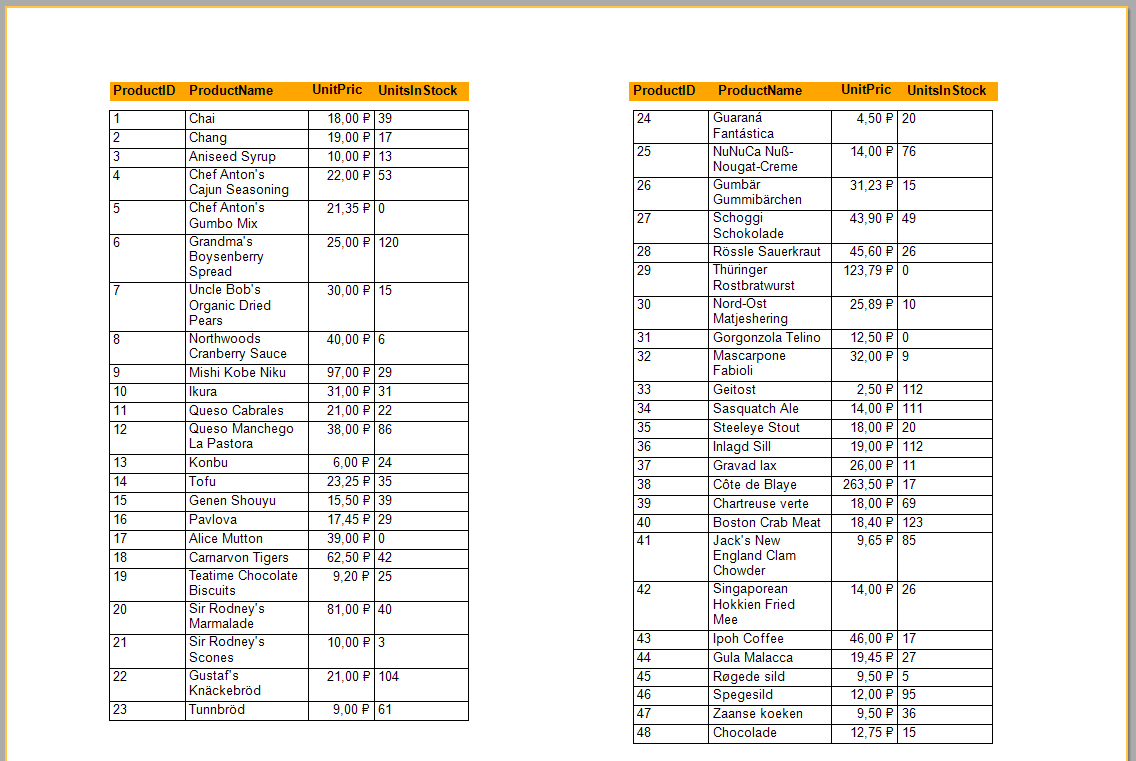
6) Multi-column report. This type of a report can be combined with any other type. Its essence is in splitting the data into columns, like on a newspaper page. You can specify the number of columns in the page settings. Another option is to adjust the number of columns in the properties of the Data band.
This type of a report is for you if you display several columns on a page and you would like to use the rest of the empty space.
7) Report type "Booklet". The essence of this type of reports is to provide your report with some presentability, namely, a title page, a table of contents and conclusion. Such a booklet can be printed and distributed in paper form as a finished document. This can be achieved by adding new pages to your report. You add the necessary pages and then build in the desired order by dragging tabs of the pages to the left at the bottom of the designer.
![]()
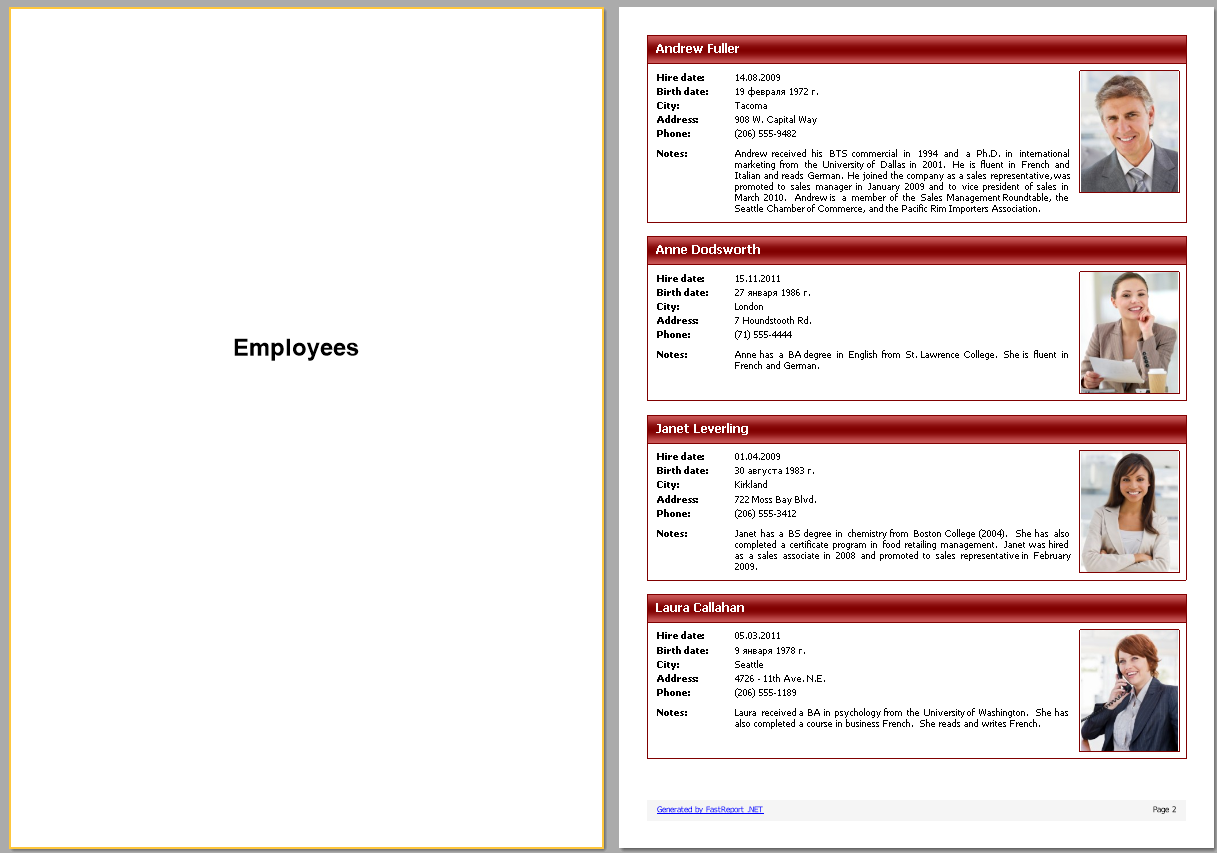
This is how a multi-page "Booklet" type report looks like:
8) Subreport. This type of reports allows to put a report into another one. That is, you put a "Subreport" object in the desired place in your report. This creates a new report page, on which you design a subreport.
When building a report, where the object is placed, the embedded report will display a report, that you have constructed on another page. After that, the output of the main report items will continue.
One may say: why should I make a separate report on the other page, if it can be done the same on the first page without a nested report? It is partly true. If a report is not complex, there is no point in dividing it into different pages indeed. The advantage of embedded reports is obvious, when creating complex, overloaded with a large number of report elements. After all, if you need to rearrange your complex report, it will require moving a large number of elements on the page. The process of formatting will be violated. This is all very time-consuming. Concerning an embedded report, you simply move the subreport object to the other location on the page and that is all. Also, there are no problems with formatting.
Here is an example of a nested report:
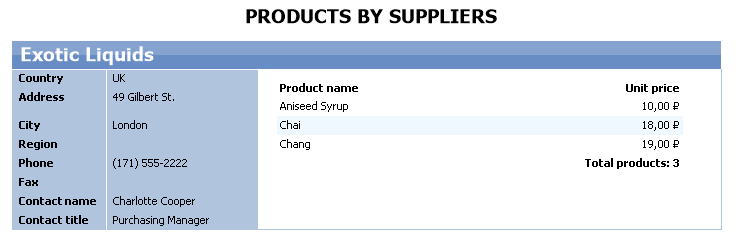
Pay attention to the white area. This table is derived from a nested report. Look at the report template:
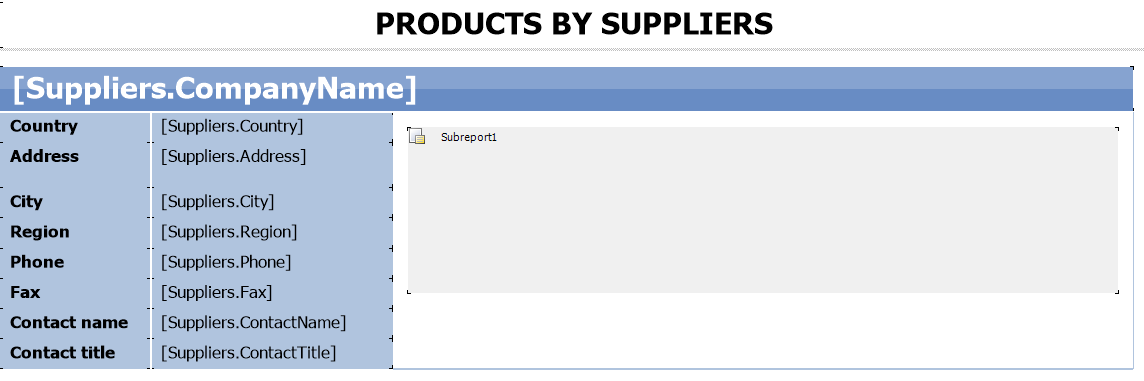
We can arbitrarily change the embedded report and at the same time it will always be displayed in the right place without violating the formatting.
9) Inherited report. In the continuation of the topic with embedded reports, we will also examine the inherited ones. In this case, you have a base report in a separate file. Then you create the inherited from the base report and have the template already prepared. You just add new items. In this case, you can always change the base report, and in all inherited reports, its template will also change. This is the main advantage of the inherited reports.
When can this be useful? For example, you create a series of reports for an enterprise. A report from the series contains a header with the name of the company and other data - this is a template, adopted for all documents of the enterprise. If the address of the company or phone, or any other parameter changes, you will need to make only one edit in the base template, not in each of the reports, created for the enterprise. D you agree, that it is convenient?
How to make a base template? Create a new report and decorate it in the style of an enterprise template.
How to make an inherited report? Create a new report and select "Inherited report":
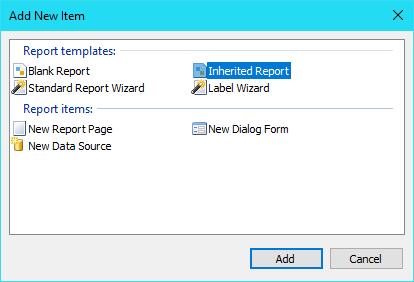
You will be prompted to select the base report file on the local disk.
10) Report with a chart. Maybe I should not consider this type of reports a separate one because you can embed the chart in any of the previously discussed types. But you still should to pay much attention to the diagrams. Most of all, charts are placed in separate reports or on separate pages.
FastReport offers an impressive set of chart types:
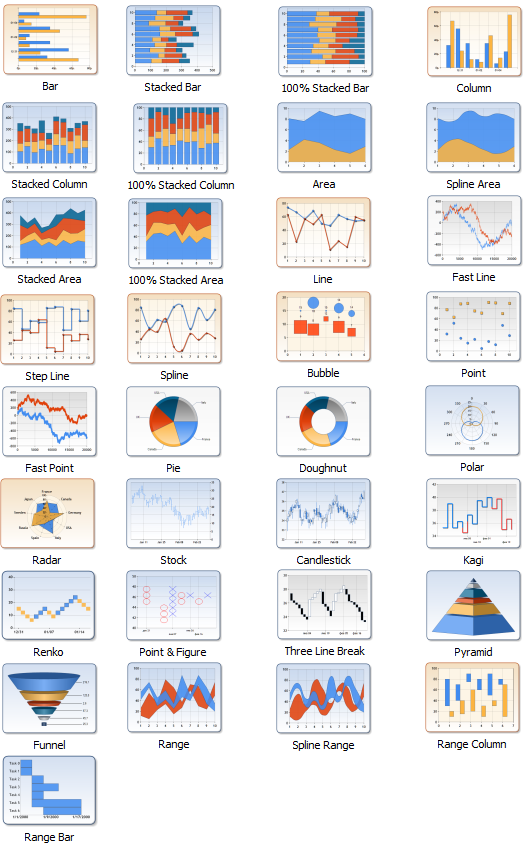
Diagrams can be three-dimensional. You just need to mark the parameter when creating your series.
11) Report with a map. The same as charts, you can build maps into your reports. You load a map file into a Map object and you can view it in the report, using a mouse like Google maps:
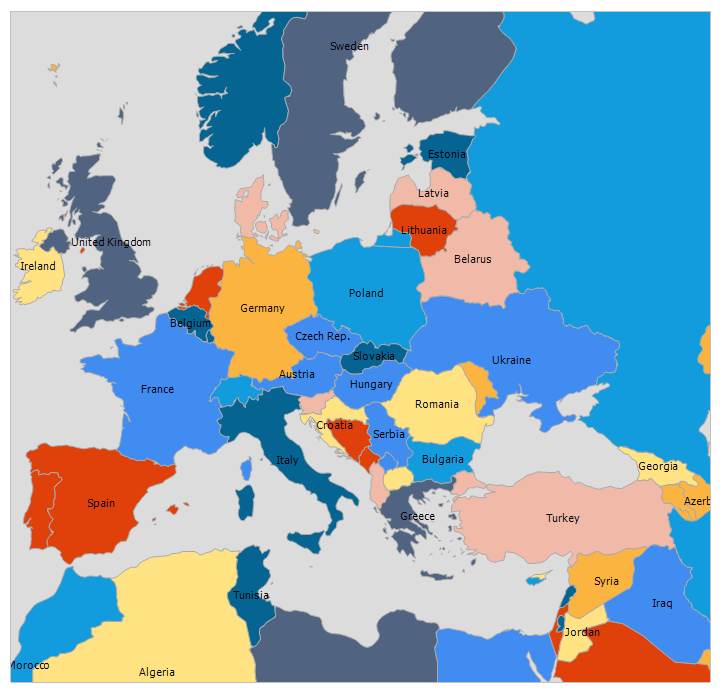
I would like to say, that you can move your map by dragging it with the mouse, and also zoom it in, using the scroll wheel. Such a report gives some kind of interactivity. A user interacts with a report to obtain the necessary information. In addition, you do not need to download maps as pictures, which will take up a lot of space. The interactive map is convenient and compact.
12) Matrix report (summary). You may have encountered (cross-tabulated) tables in Excel. However, it is important o remind you what a cross table is. It is a table with two inputs, one of which is columns and the second one is a row. At the intersection of a column and a row there is a cell with data.
The simplest example is the multiplication table:
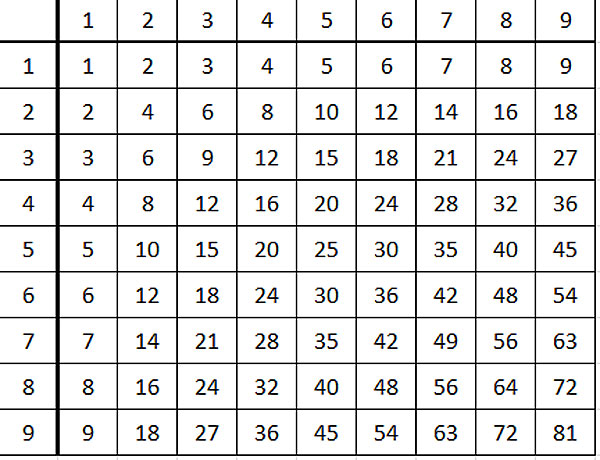
A typical matrix. The same way, you can compose the data, for example, on sales:
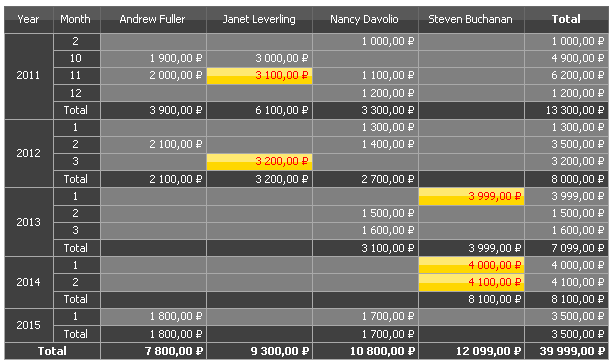
We deduce the sales amounts for each employee by years. In this format, it is very convenient and fast to analyse large data. Look at what the same data would look like in a simple list:
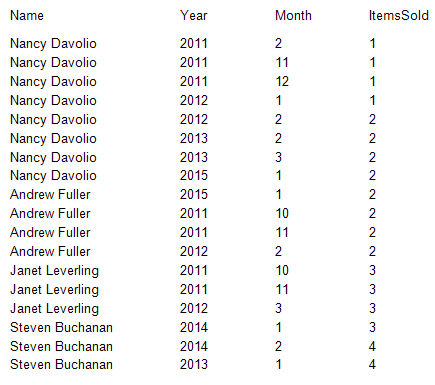
Indeed, it is not convenient to examine such a list. How to deduce this amount of data for each employee? You should group it. All this causes inconvenience and consumes time for analysis.
Thus, a matrix makes it possible to structure and summarize large amounts of data, which is a sort of simplification of OLAP.
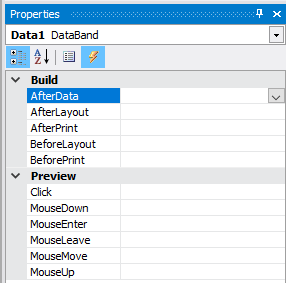
13) Report with the script. As you already understood, the examined reports in FastReport have a built-in script, that allows you to manage the report objects in the code fully. Each object, as it is supposed, has events in addition to properties. For example, using the BeforePrint event, you can convert data before displaying. After the AfterPrint event, you can automatically send the report by email:
FastReport .NET allows to write a script in two languages C # and VB .NET.
The data-processing tool in the report generator is extensive, but there are still situations when it is not enough. In such cases, it is better to apply the report script.
Thus, the script allows us to:
- manage the display of report objects (color, location, visibility, etc.);
- convert data - perform complex calculations or transform data types;
- manage the formation of some objects, such as matrix or table (add / delete columns and rows).
For example, here is such a simple handler for the BeforePrint event for a text object, that allows it to be shifted with each subsequent displaying:
1 2 3 4 5 |
private void Text1_BeforePrint(object sender, EventArgs e) { Text1.Left = left; left += 30; } |
14) Report with a dialogue form. Reports of this type contain one or more dialog forms, that are displayed before the report is built. Thus, you can back up any data on the form and manage the report's behavior.
For example, you can select some data to filter:
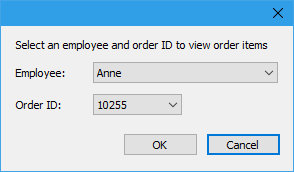
And the drop-down lists are filled with data from the source. A fairly large set of controls is available for the dialog form. I think all your needs they will satisfy.
Basically, dialogs are used for filtering or setting the value of report parameters. However, you can place controls on the form, and in the report script you can process the values of these elements and control the report's behavior: hide bands, sort data to open lists, etc.
14) Interactive report. This is a report, that allows a user in addition to view information and interact with it. For example, clicking on an item moves to the specified location in the report, or build a detailed report on the other page.
Any of the presented reports can be interactive. You just need to add a hyperlink or create a report plan, which you can use to navigate through groups or specific values.
For example, here is a list of categories with hyperlinks:
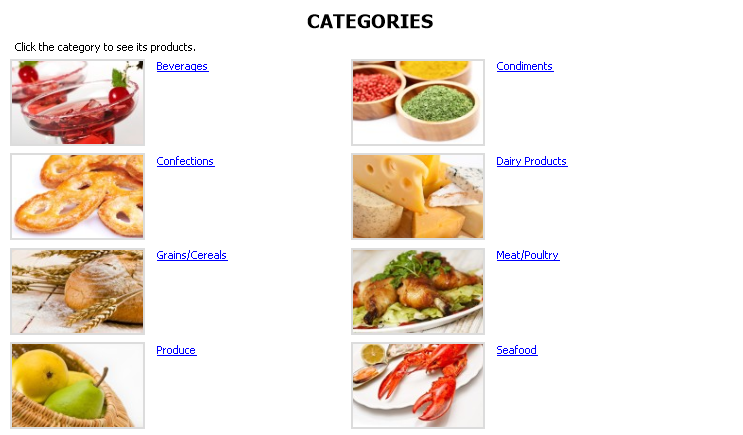
Click on the hyperlink:
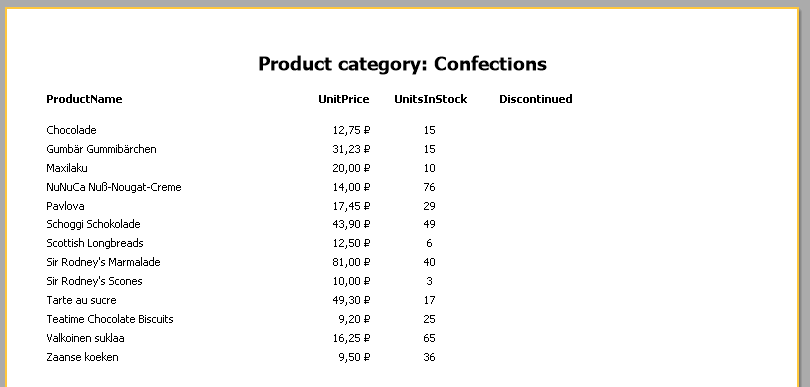
Then, get a detailed report for this category.
So, in this article we have examined the main 15 types of reports, that you can build with FastReport .NET. This set should be enough for all the events of life, and if not - soon there will be new ones.