Interactive web report with drill down lists
In this article we look at how to create interactive reports with drop-down groups. We will group the records and display the groups in a collapsed form. If necessary, the user opens and views the contents of a group. This functionality can significantly improve the user experience with the lists. Because groups occupy minimal space in the report, without overloading it with data. You are currently viewing the data for opened group only.
Let's create a report with groups.
I used a database nwind.xml from FastReport.Net delivery. For work, we need only one table - Products.
The report template consists of five bands:
• Report title;
• Group header;
• Data;
• Group footer;
• Page footer.
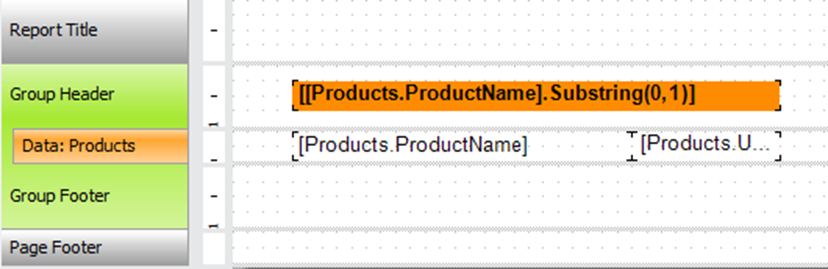
In the data band, place the fields: Products.ProductName, Products.UnitPrice.
In the group header, we will display the first letter of the product name:
[[Products.ProductName].Substring(0,1)]
Double-click on the band GroupHeader.
In the band’s editor, enter the expression to group products by the first letter.
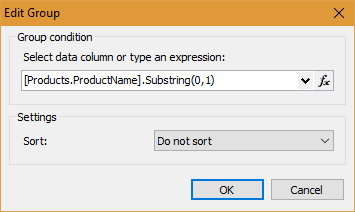
Sort disabled.
Now double-click on the data. In the band’s editor, select the tab Sort:
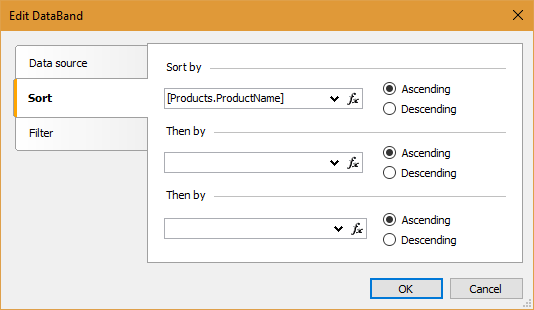
Sort by product name.
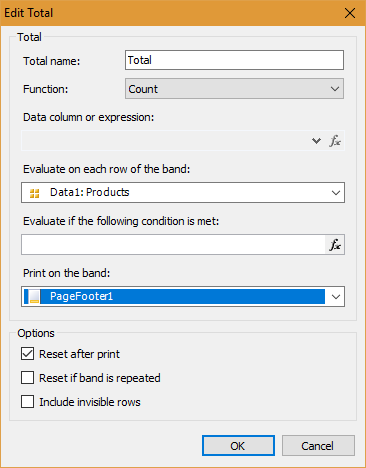
Add a new Total in the data window:
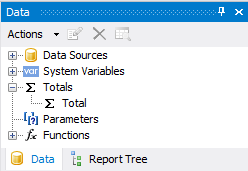
As a function, use Count:
Drill-down lists usually have a "plus sign", which means that the group is collapsed. In the expanded list, the icon changes to a minus. To realize this we use the CheckBox component. Place it near the group header:
![]()
Change CheckedSymbol in the properties of the added object. Select Plus. And for UncheckedSymbol select Minus.
Now we define hypperlink property for the CheckBox object and a text field on the right:
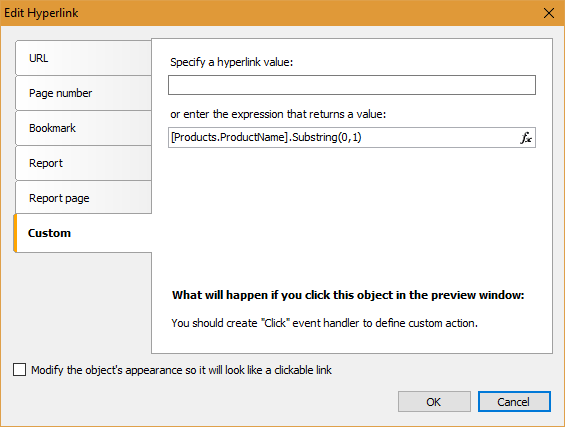
On the custom tab, set expression:
[Products.ProductName].Substring(0,1)
It's time to program a little bit. Choose band GroupHeader. In the Property inspector, select the Events tab. We find the event BeforePrint and then double-click on it. Add the following code for the handler:
1 2 3 4 5 6 |
string groupName = ((String)Report.GetColumnValue("Products.ProductName")).Substring(0, 1); //Gets group name bool groupVisible = expandedGroups.Contains(groupName); //Check the group visibility Data1.Visible = groupVisible;// Sets a data visibility according with group visibility GroupFooter1.Visible = groupVisible;// Sets the group footer visibility according with group visibility CheckBox1.Checked = !groupVisible;//Sets the checkbox condition according with group visibility |
Now create a list of visible groups. It is useful to us later:
private List<string> expandedGroups = new List<string>();
Let's go back to the page of the report. Choose object CheckBox. In the Property inspector, we switch to the Events and create a handler for the Click by double-clicking.
1 2 3 4 5 6 |
string groupName = (sender as CheckBoxObject).Hyperlink.Value; // Gets group name from hyperlink if (expandedGroups.Contains(groupName)) //If the list of visible groups contains selected group expandedGroups.Remove(groupName); // Then delete selected group from the list of visible groups else expandedGroups.Add(groupName); //Else add group to list of visible groups Report.Refresh(); //Refresh the report |
The report is ready. Proceed to the creation of web applications.
I'm using ASP.Net MVC project.
Adding FastReport.dll library, FastReport.Web.dll supplied FastReport.Net into Reference.
In HomeController, add the following code:
Add the libraries:
1 2 3 4 5 6 7 8 9 10 11 12 13 14 15 16 |
using FastReport.Web; using System.Web.UI.WebControls; public ActionResult Index() { WebReport webReport = new WebReport(); webReport.Height = Unit.Percentage(100); webReport.Width = Unit.Percentage(100); string report_path = "J:\\Program Files (x86)\\FastReports\\FastReport.Net\\Demos\\Reports\\"; System.Data.DataSet dataSet = new System.Data.DataSet(); dataSet.ReadXml(report_path + "nwind.xml"); webReport.Report.RegisterData(dataSet, "NorthWind"); webReport.Report.Load(report_path + "InteractiveDrillDown.frx"); ViewBag.WebReport = webReport; return View(); } |
Let us line by line:
1. Create an instance of the report object;
2. Set the height of web report to 100%;
3. Set the width of the web report to 100%;
4. Set the reports directory;
5. Create a data source;
6. Load the database into the data source;
7. Register the data source in the report;
8. Load the report;
9. Pass the report to View.
Now edit the view Index.cshtml:
1 2 3 4 |
@{ ViewBag.Title = "Home Page"; } @ViewBag.WebReport.GetHtml() |
In _Layout.cshtml file add scripts and styles:
1 2 3 4 |
<head> @WebReportGlobals.Scripts() @WebReportGlobals.Styles() </head> |
In the Web.config file from the View folder, add namespaces:
1 2 3 4 |
<namespaces> <add namespace="FastReport" /> <add namespace="FastReport.Web" /> </namespaces> |
In the Web.config file from the root of the project, add a handler:
1 2 3 4 5 6 |
<system.webServer> <handlers> … <add name="FastReportHandler" path="FastReport.Export.axd" verb="*" type="FastReport.Web.Handlers.WebExport"/> </handlers> </system.webServer> |
Now run the Web application:
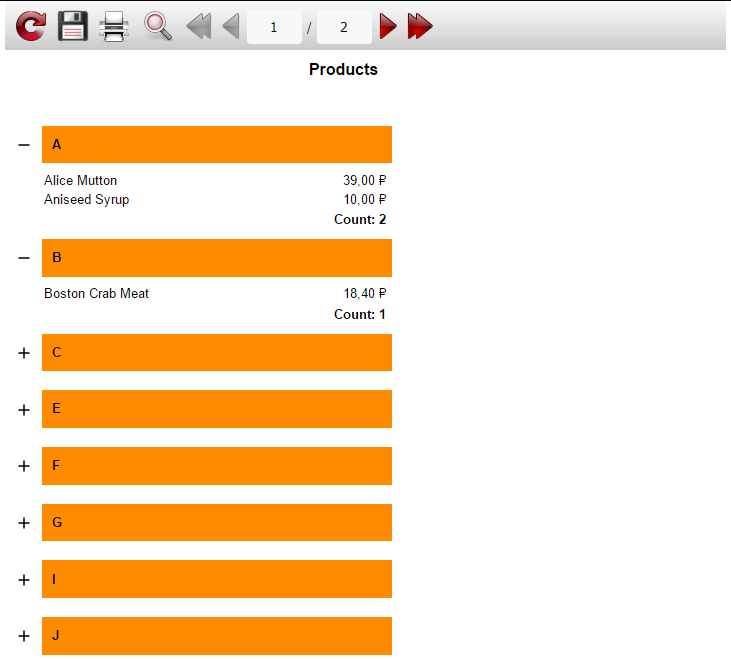
As you can see, when you click on the cross or group header it expands. In this case the plus sign changes to a minus. If you again click on the group header or minus, the group collapses.
This is how we can create interactive drill-down lists in web reports.