Interactive matrix in a web report
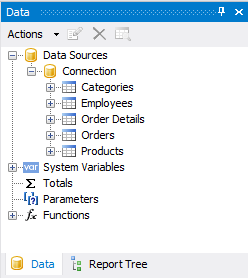
Let us remember how to create an interactive matrix. We use the xml data base of FastReport.Net delivery. Choose the tables:
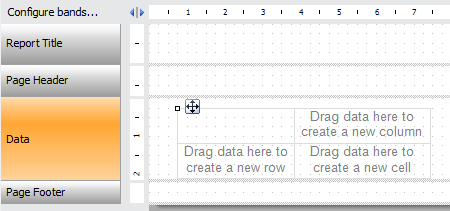
Add the object Matrix on the data band:
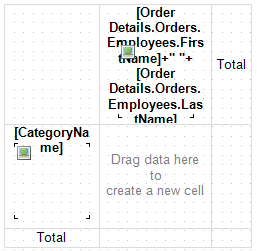
Now open the Order Details table in the data window. You will see a table connected: Products and Orders. Open Orders. It has another connected table Employees. We open it and drag the FirstName field at the column header:
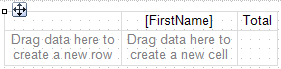
Double-click on the added field. Let's add field LastName to the FirstName, to display employee name. Thus, the field will be formed as follows:
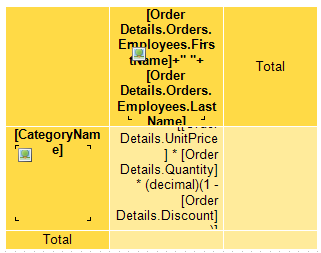
[Order Details.Orders.Employees.FirstName]+" "+[Order Details.Orders.Employees.LastName]
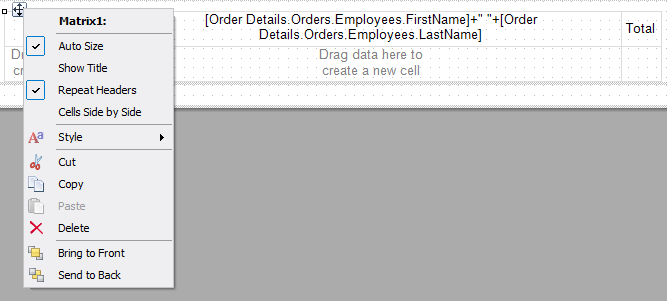
This greatly expands the column header. Let's disable feature "AutoWidth". To do this, right click on the Matrix object. And select Auto Size from the context menu:
Now you can adjust the size of rows and columns.
Drag the Photo field at the column header. Adjust the cell size to fit both the added field.
Now find connected Products table in the Order Detail table. Open it. It has also a connected Table Categories. Drag the CategoryName field at the row header from the Categories table. Put the field Picture into the same cell.
Now drag the Unit Price field from the Order Details table to the data cell. Edit the added field. We need to find the product of three fields: UnitPrice, Quantity, and 1-Discount. Thus we find the real total of of sales:
[Order Details.UnitPrice] * [Order Details.Quantity] * (decimal)(1 - [Order Details.Discount])
Matrix is almost ready. It remains to choose the style. Right-click on the template and select Style. For example, Orange. It’s already pretty:
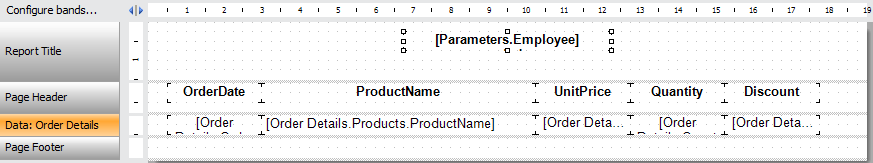
Create a detailed report on a separate page. Add a second page in the report.
Add Field Order Details.OrderDate on the data band. Place the field Order Detail.Products.ProductName beside him. Also, we drag the field: Order Detail.UnitPrice, Order Detail.Quantity, Order Detail.Discount.
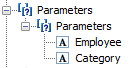
To display the data for the desired employee's need to filter the table. We will transfer the data to compare from the first page to the second. To do this, create a parameter in the second page. For this option, we create two sub-parameters, both of type string
Now let's add a filter to the band “data”. Double click on it and choose the Filter tab:
[Order Details.Orders.Employees.FirstName] + " " + [Order Details.Orders.Employees.LastName] == [Parameters.Employee] && [Order Details.Products.Categories.CategoryName] == [Parameters.Category]
Here we compare the first name + last name of employee with the parameter, and the category name with the parameter.
Add a header for a detailed report:
[Parameters.Employee] order's.
The result - the template:
Let's go back to the first page. Select data field of the matrix. In the Property inspector, find Hyperlink and open the hyperlink editor. Tab Report page:
Select the second page and the parameter Parameters. The values of sub-parameters will be inserted automatically.
The report is ready. Save it.
Now create a Web application. I'm using ASP.Net MVC project.
Add a reference to libraries FastReport.dll FastReport.Web.dll.
HomeController.cs find the file in the Controllers folder. This controller of start page. Here we will work with the report object.
Add the missing libraries:
1 2 |
using FastReport.Web; using System.Web.UI.WebControls; |
And the code for the method Index, which is responsible for the start page:
1 2 3 4 5 6 7 8 9 10 11 12 13 |
public ActionResult Index() { WebReport webReport = new WebReport(); //create the instance of the WebReport. webReport.Width = Unit.Percentage(100); //set the webReport object width 100% webReport.Height = Unit.Percentage(100); //set the webReport object heigh 100% string report_path = "J:\\Program Files (x86)\\FastReports\\FastReport.Net\\Demos\\Reports\\"; //reports folder System.Data.DataSet dataSet = new System.Data.DataSet(); //create a dataset dataSet.ReadXml(report_path + "nwind.xml"); //load the xml db webReport.Report.RegisterData(dataSet, "NorthWind"); //register db in thr report webReport.TabPosition = TabPosition.Hidden; //hide the detail reports tabs webReport.ShowBackButton = true;// show back button ViewBag.WebReport = webReport; //pass the web report to View return View(); } |
There are two options of interest: TabPosition and ShowBackButton. The first is responsible for the display of the tabs in the toolbar reports. We hid the tabs. The second option sets a button «Back». It allows you to go back to the previous report.
Now display the report in the view. Open the file for editing index.cshtml (Views- folder> Home).
We set the page title and displays Web reports:
1 2 3 4 |
@{ ViewBag.Title = "Home Page"; } @ViewBag.WebReport.GetHtml() |
In _Layout.cshtml file add scripts and styles in the section <head>:
1 2 3 4 |
<head> @WebReportGlobals.Scripts() @WebReportGlobals.Styles() </head> |
Add the namespace in the Web.config file that is in the Views folder:
1 2 3 4 |
<namespaces> <add namespace="FastReport" /> <add namespace="FastReport.Web" /> </namespaces> |
Add the handler Web.config file that lies at the root of the project:
1 2 3 4 5 |
<system.webServer> <handlers> <add name="FastReportHandler" path="FastReport.Export.axd" verb="*" type="FastReport.Web.Handlers.WebExport"/> </handlers> </system.webServer> |
Run the application. Our matrix looks like this:
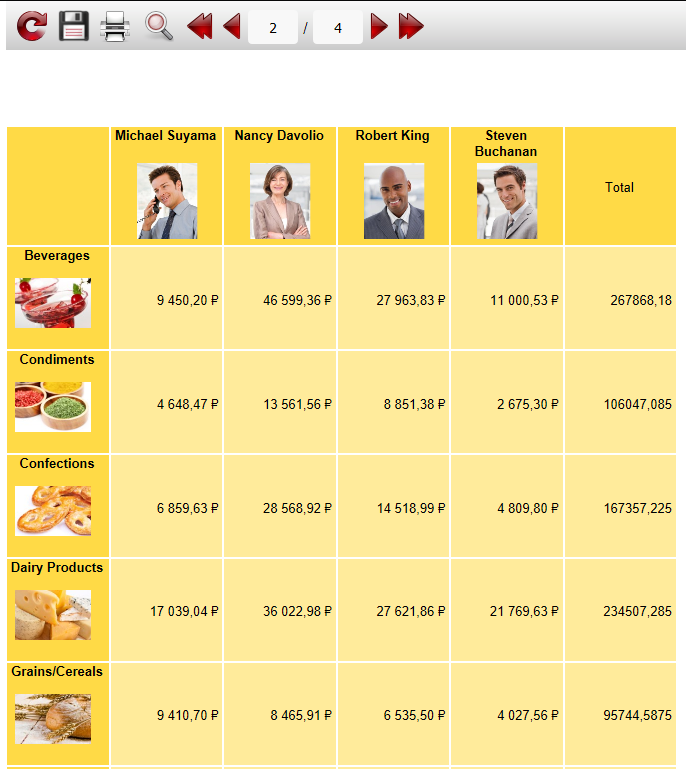
Click on the category total of any data cell. And we see a detailed report for the relevant personnel and categories:
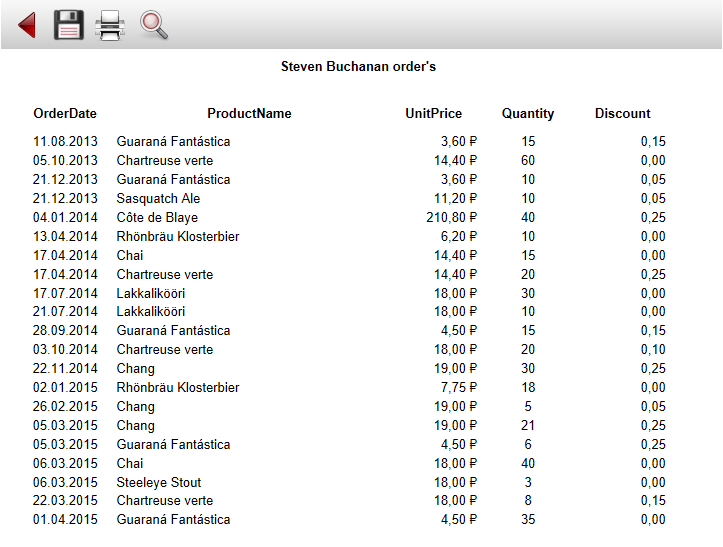
In a detailed report shows all orders placed this employee by goods from the selected category.
Now we know how to create an interactive template for the Web. One more type of report to the our piggy bank.