Initial knowledge for understanding reports FastReport .NET
The concept of a "report generator" has appeared relatively recently.
Let us define what it is. A report generator is a program, that allows you to create documents, which are ready for demonstration and based on a set of data. First report generators were rather primitive and allowed to create documents only in most common formats. They were rather slow in dealing with a large amount of data. The interface for creating a report template left a lot to be desired. Therefore, many developers themselves created reports in a code of their application. It took a lot of time and effort.
However, the flagship development of report generators quickly took into account the shortcomings of the first versions and turned their products into really convenient and fast programs. Nowadays, no one wants to generate Excel reports manually.
The principle of working with the report generator is quite simple. Most programs include a report designer, which allows you to create a template. You design your document by arranging text fields, tables and pictures. While building a report, the generator takes a template and fills it with some data. Besides that, you can get many pages if you have a lot of data. Then, you export the report to the desired format: doc, pdf, xls, etc. That's all.
Most processes can be automated. For instance, generate a report according on schedule, automatically export it to the desired format and send by email. However, the process cannot be fully automated without any manual work as one needs to has to a report template. In this case a variety of "masters" for creating reports are ready to help. It reduces manual work while creating a simple report up to a few mouse clicks.
Let us consider one of the brightest representatives of report generators FastReport.Net. As you already understood .Net means that this report generator is working with this framework, which allows us to use it in any .Net application.
Here is a structure of a report in FastReport.Net.
1) A report consists of pages. By default, all reports have one page, but you can add as many new ones as you need. These are the pages of the templates, not the ones, which are displayed when building a page. Each page of the template, while being filled with data, can be represented by many pages of the constructed report, depending on the amount of data;
2) Each page of the report includes blocks of data placement - bands. Bands are different in their purpose: head bands, band-data, basement bands.
3) Report objects are various control elements, such as a text box, a checkbox, a picture, a table, a matrix, a graph, etc. Basically, they are used to display data, but there are also purely decorative figures.
Consequently, we get the necessary chain for displaying the data in the report: page-band-object. This means, that the report should be at least one of the listed elements to display information.
On the contrary to the topic "pages", "bands" will cause a lot of questions from immature users. Therefore, let us consider them in detail.
1. Header bands. They contain headings. It can be:
- • The title of the report;
- • The title of the page;
- • Data header;
- • Group title.
They behave differently when making a report. The first band is displayed only once at the beginning of the report. The second one is on each page of the report. The third one, the same as the first one, is displayed only at the beginning of the report. The fourth band is at the top of each column. The fifth one is shown when each group is displayed.
2. The Data band is the basis of the report, designed to output data from the source. This band is generated for each line of data from the database table. There may be several Data bands in a report. This means, that this data will be output from several database tables, because each data band connects to a specific table.
3. Footer bands are the same as headers. They can contain totals or data, that you need to post at the very end of a report. There are the following footer bands:
- The footer of the report;
- Page footer;
- Footer;
- Column footer;
- Group footer.
By analogy with the header bands, the following parts of your report are output: the report's basement is at the end of the report, the basement of the page is at the end of each page, the database is immediately output after the Data band, the column footer is after each column, the cellar of the group is at the end of each group.
As it was mentioned before, objects are placed on bands and most of them are intended to output information.
Now a few words about each of the objects. The main object of data output is "Text". In a text object you can write any information. To display the field from the source you need to use direct brackets []. We enclose the [Table.Field] field in parentheses. This expression will be replaced with data from the database.
Objects such as the Matrix (Pivot Table) and Table are based on data from the database.

As you can see, the given table has some text data, which are output using a "Text" object. Also, there are pictures that are displayed using the object "Picture". From this it can be concluded that some objects can include others.
Pictures can be downloaded from a local folder or directly from a database as in the example above.
The Chart objects are based on the data from the database (it is possible to set the data manually). The values for the "X" and "Y" coordinate axes are specified:
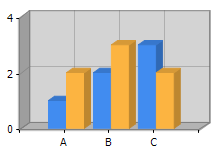
There are many kinds of charts. The most common is the histogram, shown above.
Subreport is one report, that can be placed in the desired place of your current report.
Formatted text is a text object, whose display format you specify at the creation stage in the editor. Of course, you can configure any test object after creation.
Zip Code is a specially formatted object for displaying zip codes and mail envelopes:

Barcode has a wide range of barcodes of various standards. It is built on the basis of manually entered data or according to the data from the database:

CheckBox object is an indicator for data fields with the Boolean type.
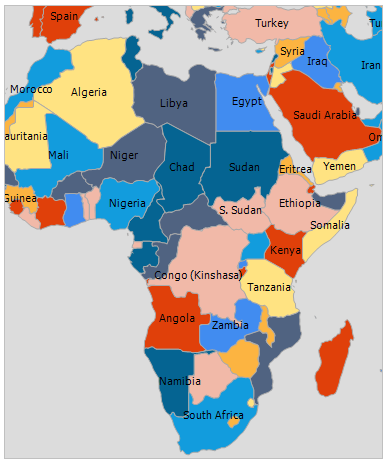
Map object allows you to insert interactive maps into your report. You can navigate your map, zoom it in and zoom it out, like in google maps.
Sparkline and Gauge is a variety of charts.
The shapes are of a decorative nature. With the help of them we can organize simple vector graphics in a report.
Text in cells is styling of a text, symbol-by-symbol in each cell. It is usually used in questionnaires.
![]()
Summing up, in this article there has been illustrated the main mechanism of creatng reports in FastReport. We hope this introductory information will help you to understand the report structure of FastReport.
The next article seeks to describe and examine the bands in detail. As long as this topic poses some difficulties, its main aim is to clarify the most problematic points of the topic, so that you will be able to design reports of any complexity.