FastCube.Net components. Part 1. Cube, CubeGrid, CubeGridToolbar, Slice, SliceGrid, SliceGridToolbar.
In this article, we'll consider the components included in the FastCube.Net library.
List of components:
- Cube – the main component that loads a cube from a file and fills it with data;
- CubeGrid – It is intended for displaying all data of a cube. Visual component;
- CubeGridToolbar – is a toolbar for CubeGrid;
- Slice – contains a cube slice;
- SliceGrid – is intended for displaying a cube cut. Visual сomponent;
- SliceGridToolbar – toolbar for the Slice grid;
- Chart – chart, based on the slice data;
- ChartToolbar – toolbar for the chart;
- DataSource – data source for a cube.
- DBDataSet – data set obtained from the database;
- DTDataSet – data set from the DataTable.
Let's look at the components relationship scheme.
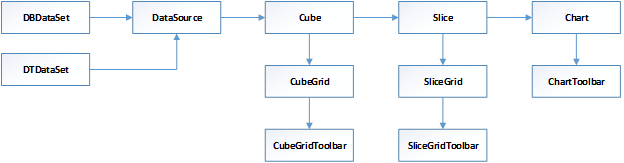
We consider the scheme from left to right. The DataSource object has a DataSet property. The value of this property is a reference to one of two objects: DBDataSet or DTDataSet.
The Cube object has the DataSource property. A CubeGrid and Slice are related with the Cube object.
In turn, SliceGrid and Chart are related with the Slice object. In the future, this scheme will help us in setting up the connection of components.
In the meantime, let’s consider the components:
1) The Cube component is the basis of the entire FastCube. It loads the cube file and acts as the data provider and data scheme provider for the other components.
Below there are main properties and methods of this component.
Properties:
|
Property |
Description |
|
Active
|
The activity is true or false. It is important to make sure that after all the settings, the Active property is set to true. Otherwise, you just will not see any data. |
|
Caption |
Cube header. Visible in the CubeGrid. |
|
CompressCubeFile |
Whether to use cube file compression |
|
DataSource
|
The data source must be selected if you fill the cube with data from the database or DataTable. |
|
Description |
Description. It can be seen in CubeGrid |
|
SkipFieldsWithErrors |
Ignore fields with errors |
|
SourceType
|
The type of the data source indicates where to get the data to fill the cube. Can take one of the values:
|
Methods:
|
Method |
Description |
|
ClearGroups() |
Clear grouping. |
|
Close() |
Close cube. |
|
GetFieldsCount() |
Get the number of fields in a cube. |
|
GetSourceRecordsCount() |
Get the number of records in the data source. |
|
GetSourceValue() |
Get the value of the data source. |
|
GetSourceValueAsString() |
Get the value of the data source as a string. |
|
GetSourceValueId() |
Get the ID of the data source value. |
|
GetSourceValueIdAndVariant() |
Get the ID of the data source value. |
|
Load() |
Load cube. File or stream. |
|
LoadGroups() |
Load grouping. |
|
Open() |
Open the cube. |
|
Save() |
Save the cube to a file. |
|
SaveGroups() |
Save grouping. |
|
Dispose() |
Destroys the cube object. |
|
SendAlert() |
Send alert to user. |
Examples of use in the code:
1 2 3 4 5 |
FastReport.Olap.Cube.Cube cube = new FastReport.Olap.Cube.Cube(); cube.DataSource = dataSource1; cube.SourceType = FastReport.Olap.Cube.SourceType.DataSource; cube.Load("С:\\Program Files (x86)\\FastReports\\FastCube.Net Professional\\Demos\\Data\\Cubes\\2_0_sample_en1.mdc"); cube.Active = true; |
If you are using a cube file that contains data, you do not need to set the DataSource property. And for the SourceType property, you need the value FastReport.Olap.Cube.SourceType.File.
2) The CubeGrid component is a summary table filled with data from a cube. Simply saying - a visual display of the cube.
Properties:
|
Property |
Description |
|
Сube |
Cube object. |
|
DataZone |
Settings for displaying data in the grid. |
Methods:
|
Methods |
Description |
|
Export |
Export a cube to one of the following formats:
|
|
CreateDataZone |
Create a new data zone. |
|
FullUpdate |
Update the data zone and the captions zone. |
Examples of use in the code:
1 2 3 4 |
CubeGrid cubeGrid = new CubeGrid(); cubeGrid.Dock = DockStyle.Fill; cubeGrid.Parent = tabPage2; cubeGrid.Cube = cube; |
The above example shows how to create a cubeGrid from the application code. The created object needs to be placed on the form (the Parent property), and set up the location (the Dock property). In addition, you must specify a cube from which to take the data.
3) The CubeGridToolbar component is a toolbar that works in conjunction with the cubeGrid component.
![]()
This toolbar provides only one element - export. The table below shows the available export formats.
Properties:
|
Property |
Description |
|
Grid |
Grid for which acts toolbar. |
|
ToolItems |
List of elements of the toolbar. |
Examples of use in the code:
1 2 3 4 |
CubeGridToolbar cubeGridToolbar = new CubeGridToolbar(); cubeGridToolbar.Dock = DockStyle.Top; cubeGridToolbar.Parent = tabPage2; cubeGridToolbar.Grid = cubeGrid; |
If the Dock and Grid properties can be configured in the Property inspector, then “Parent” needs to be set only in the program code.
4) The Slice component contains a slice of the cube. To load a slice, you need to download a file with a slice. This can be a cube file or a scheme file.
Properties:
|
Property |
Description |
|
AutoUniqueValuesFilter |
Filter duplicate values. |
|
Cube |
Cube object. |
|
FieldsOrder |
The order of displaying fields: ByIndex, ByName, ByCaption. |
|
ColCount |
Number of columns. |
|
HideColZeros |
Hide empty columns. |
|
HideRowZeros |
Hide empty lines. |
|
HideTotalForSingleValue |
Hide the total if there is only one value. |
|
MeasuresContainer |
Container that contains the measures. |
|
RowCount |
The number of rows in the grid. |
|
ScriptLanguage |
It can be CSharp or Vb. |
|
ScriptText |
Script code. |
|
ScriptRestristions |
Configuring Script Restrictions. |
|
SliceFields |
List of the slice fields |
|
XAxisContainer |
Container for fields placed along the X axis. For dimensions. |
|
YAxisContainer |
Container for fields placed along the Y axis. For dimensions. |
Basic methods:
|
Methods |
Description |
|
BeginUpdate |
Enable update mode. |
|
EndUpdate |
Finish the update. |
|
Clear |
Clear the slice data and fields. |
|
Save |
Save the slice. When you save a cube, it runs automatically. |
|
Load |
Load a slice from a file or stream. |
|
Transpose |
Transpose the slice (change axes). |
Examples of use in the code:
1 2 |
FastReport.Olap.Slice.Slice slice1 = new FastReport.Olap.Slice.Slice(); slice1.Cube = cube; |
5) The SliceGrid component displays a slice in the form of a crosstab. This is the main tool of the analyst. Allows you to customize the layout of fields, to add new ones, to sort, to group and more.
Properties:
|
Property |
Description |
|
DataZone |
Settings for displaying data in the grid. |
|
XAxisZone |
X-axis display area settings. |
|
YAxisZone |
Y-axis display area settings. |
|
FilterFieldsZone |
Filter zone settings. |
|
XFieldsZone |
Setting the area of displaying dimensions on axis X. |
|
YFieldsZone |
Setting the area of displaying dimensions on axis Y. |
|
FieldsZone |
Field list zone settings. |
Methods:
|
Methods |
Description |
|
Export() |
The method of exporting a report to one of the following formats:
|
|
ShowFieldsEditor() |
Open the window with the list of fields of a slice. |
Examples of use in the code:
1 2 3 4 |
SliceGrid sliceGrid = new SliceGrid(); sliceGrid.Dock = DockStyle.Fill; sliceGrid.Parent = tabPage1; sliceGrid.Slice = slice1; |
This example shows how to create a sliceGrid object in the application code. If there is no such need, then all the settings can be made in the Property inspector.
6) The SliceGridToolbar component is a rendered toolbar for the SliceGrid:
![]()
The toolkit is as follows:
1) Save:
- cube;
- scheme.
2) Open:
- cube;
- additional cube;
- scheme.
3) Clear grid;
4) Export to:
- HTML;
- DBF;
- CSV;
- XML;
- Open Document Spreadsheet;
- Excel;
- Excel 2007.
5) Transport - change the X and Y axes by places;
6) Hide row zeros;
7) Hide column zeros;
8) Row sort type:
- Sort by value of the axis;
- Sort by measures totals;
- Sort by focused column.
9) Column sort type:
- Sort by value of the axis;
- Sort by measures totals;
- Sort by focused row.
10) Edit measures - settings of indicators. This includes setting up conditional data highlighting;
11) Display format - is set for the selected column or row;
12) Field list - a list of all fields available in the slice;
13) The formula editor is intrinsically a script editor in the programming language C # or VB;
14) Information - information about the slice;
Properties:
|
Property |
Description |
|
Grid |
Grid for which acts toolbar |
|
ToolItems |
List of Toolbar Items |
An important feature of using this component is the binding to the parent object in the program code. That is, it is not enough simply to "drag" the component onto the form and set its Grid property. It is necessary in the program code to set the Parent property to display the toolbar on the form. This can be, for example, a sliceGrid object, or a TabPage, Panel, or other suitable.
Examples of use in the code:
1 2 3 4 |
FastReport.Olap.Controls.SliceGridToolbar toolbar = new FastReport.Olap.Controls.SliceGridToolbar(); toolbar.Grid = sliceGrid1; toolbar.Parent = sliceGrid1; toolbar.Dock = DockStyle.Top; |
In the second part of the article we will consider the remaining objects: Chart, ChartToolbar, DataSource, DBDataSet, DTDataSet.