How to edit a report in the preview mode in Fast Report VCL 6
Some objects in FR VCL 6 can be edited in the report viewer, that is, in the .fp3 format. After changing the objects, you can save the modified report in a preview format or export it to any other format. When can this be useful? For example, you do not have a report template, but there is only a preview file for the fp3 report. You change the title of the report, or select the desired series in the diagram and send the report for printing. A particular case of such use may be the filling up the questionnaire.
What objects can be edited? Of course, most often we have to edit the text, so the "Text" object is the first in the list.
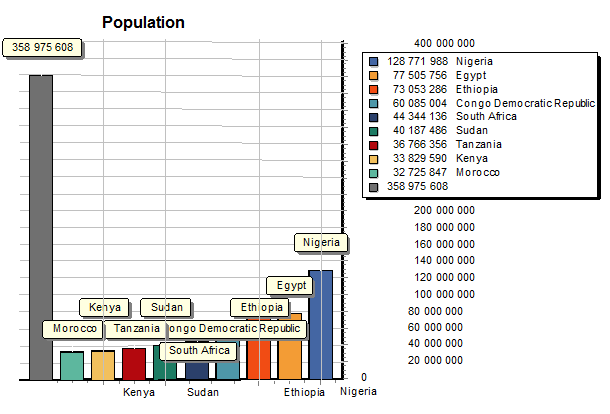
As mentioned above, the "Chart" object. If the object has more than one series, you can choose which series to display at the moment.
The "CheckBox" object. If your report is a questionnaire, you can mark the necessary items with "tick", fill in the text fields and send the document by email.
Objects "Gauge" and "Interval Gauge" allow you to set values that can be used in the report.
Editing an object Text
There are two ways to edit text objects in preview mode:
1) Hold down the Alt key and click on the Text object. The text inside the object will be highlighted. Change the text by clicking on the area outside the object. The changes are applied;
![]()
While using this method, remember that as soon as you remove the mouse pointer from this text object, editing will be completed.
2) A new icon appears on the Report Viewer toolbar ![]() - edit text. Click it and all the text objects on the page that can be edited are highlighted in blue:
- edit text. Click it and all the text objects on the page that can be edited are highlighted in blue:
![]()
Clicking on the desired object will change the text. To finish editing, move the mouse away from the edited object.
![]()
It is possible to prohibit editing text. To do this, we set the “DontEditInPreview” flag on the "Text" object in the Restrictions property. When the text editing mode ![]() is enabled, you can see which of the text objects are editable.
is enabled, you can see which of the text objects are editable.
Editing a Chart object
The diagram can be rotated, switched series, switched in 2D / 3D mode, returned the transformation to the initial view.
The most interesting thing, seemed to me, was the ability to switch the series. You just need to hover over it with the mouse pointer. This will display the series selection bar:
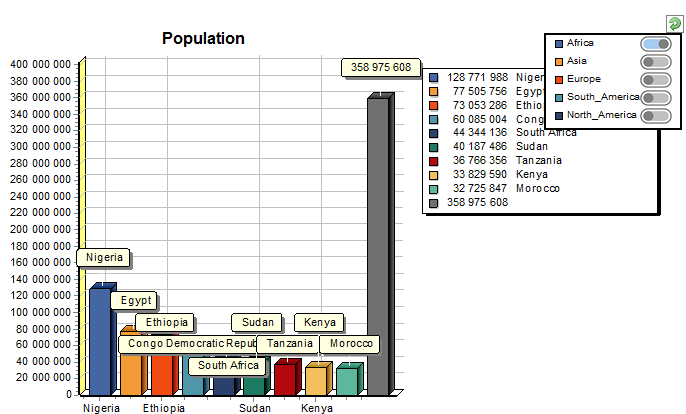
In this example, we see that there are 5 series available. By default, all series are displayed. However, this is not always convenient. Therefore, in order to set the switches to Radio Button mode, you must disable all the switches at the report creation stage, leaving only one active:
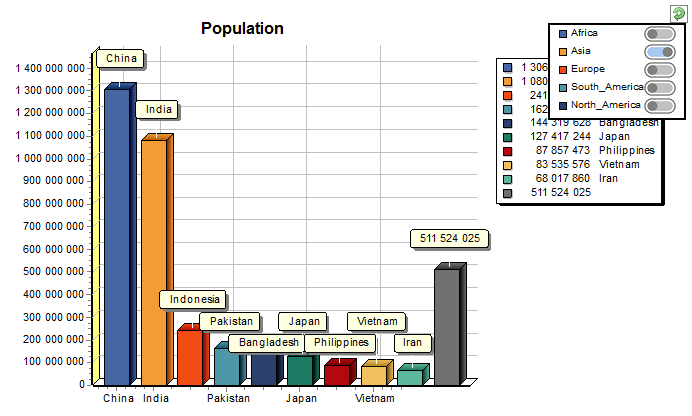
This can be done with the mouse in the same window of the series selection from the top to the right.
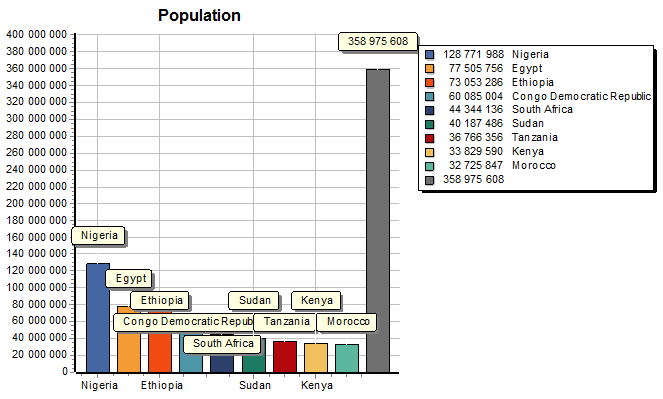
Pay attention to the icon ![]() . In the preview mode, if you did not rotate the chart, clicking on it, you can switch the chart to two-dimensional mode:
. In the preview mode, if you did not rotate the chart, clicking on it, you can switch the chart to two-dimensional mode:
Rotation of the diagram is carried out with the help of the left mouse button:
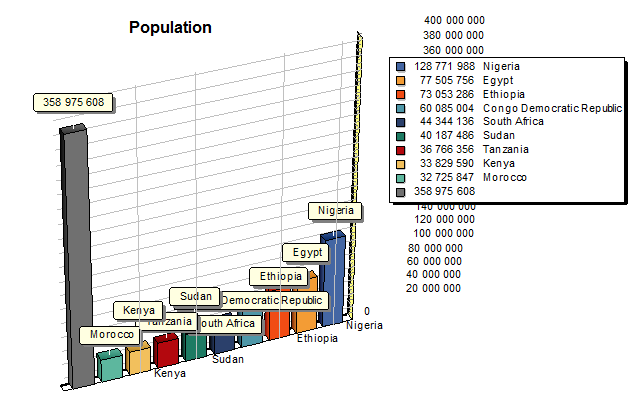
That's how I managed to mirror the diagram:
If you click the icon ![]() now, the chart will return to its original state (although in 2D mode). Press again to display your transformation.
now, the chart will return to its original state (although in 2D mode). Press again to display your transformation.
Editing objects Gauge and Interval Gauge
These are two new objects in the Fast Report VCL. They are scales with indicators simulating analog electronic devices. The difference between objects is clear from the name: Gauge displays a single value, and Interval Gauge - the value from and to, that is, the interval.
For both objects there are three types: horizontal, vertical and circular. Here's how it looks:
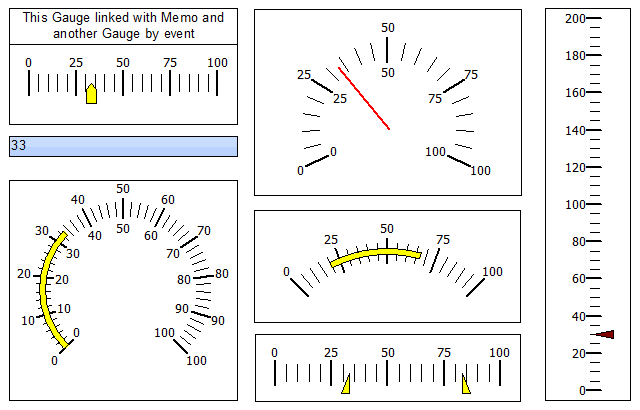
As you can see, the pointers on the scales can have different shapes, sizes and colors. Scales themselves have many settings as well.
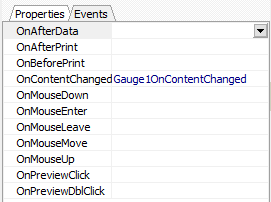
But back to the topic of the article. Gauge objects can also be edited in the preview mode. Moving indicators itself would not be very interesting without the ability to use new object values in the report. You can do this using the report script. For example, we want to display the current value of the indicator in the text field. For the indicator, add the OnContentChanged event:
1 2 3 4 5 6 7 8 9 10 11 12 13 14 15 16 17 18 19 20 21 22 23 24 25 26 27 28 29 30 31 32 33 34 35 36 37 38 39 40 41 42 43 44 45 |
procedure Gauge1OnContentChanged(Sender: TfrxComponent; ModifyObjects: TList; var Refresh: Boolean); var List: TList; View: TfrxMemoView; i: Integer; begin View := nil; List := PreviewPages.Page[PreviewPages.CurPage].AllObjects; for i := 0 to List.Count - 1 do if (List[i] is TfrxView) then begin if (TfrxView(List[i]).TagStr = 'Gauge1') then View := TfrxMemoView(List[i]); if (View <> nil) then Break; end; if View <> nil then begin TfrxMemoView(View).Text := FloatToStr(Round(TfrxGaugeView(Sender).Gauge.CurrentValue)); ModifyObjects.Add(View); end; // refresh preview Refresh := True; end; |
In this script, among all the report objects we search for the needed one, which contains the value of the TagStr value Gauge1. Then, at the found object we set the value of the Text property - the current value of the indicator. Update the preview.
Run the report in preview mode. Moving the slider, we get the current value of the indicator in the text field below.
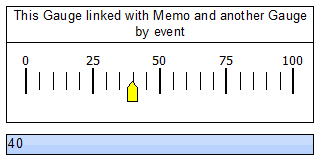
Thus, the obtained value can be used in the calculations, filtering and data query. And this turns the report into something much more than just an interactive document.
Let's sum up. The ability to edit the report in preview mode allows us to create reports that you can customize without rebuilding. Editing in preview is simple, so it is accessible to a wide range of users. They do not need experience in operating with the report designer.