Connect datasource to OLAP pivot cube (FastCube .NET)
FastCube .NET is powerful OLAP Engine which adds Business Intelligence to your application. Let's look how to bind data to its pivot table!
Typically, the data in the OLAP cubes are loaded from the database.
To fill a cube with data, you need to create a data source. And here I would like to say a few words about these sources. A cube can receive data from:
• Database (Data source) - creates a connection to the database;
• Stream - a cube can be received over the network as a stream, opened from a file, or downloaded from a database;
• Application code (Manual) - filling the cube with data directly from the application code;
• Cube file (File) - the data is already contained in the cube file along with the data scheme.
For a cube filled manually or from a database, we also need to create or load its representation. For example, you can load a ready-made representation from the mds file.
In this article, we'll look at the way of connecting a cube to a database. But first, let's look at the file with the data scheme.
1 2 3 4 5 6 7 8 9 10 11 12 13 14 15 16 17 18 19 20 21 22 23 24 25 26 27 28 29 30 31 32 33 34 35 36 37 38 39 40 41 42 43 |
<?xml version="1.0" encoding="utf-8" standalone="yes"?> <slice version="2" timestamp="12.05.2017 16:31:09"> <fields> <field name="OrderNo" caption="OrderNo" Width="0" Height="0" PopupWidth="120" PopupShowAvailable="False" Collapsed="False" CollapsedSubGroup="False"/> <field name="PartNo" caption="PartNo" Width="0" Height="0" PopupWidth="120" PopupShowAvailable="False" Collapsed="False" CollapsedSubGroup="False"/> <field name="Qty" caption="Qty" Width="0" Height="0" PopupWidth="120" PopupShowAvailable="False" Collapsed="False" CollapsedSubGroup="False"/> <field name="CustNo" caption="CustNo" Width="0" Height="0" PopupWidth="120" PopupShowAvailable="False" Collapsed="False" CollapsedSubGroup="False"/> <field name="EmpNo" caption="EmpNo" Width="0" Height="0" PopupWidth="120" PopupShowAvailable="False" Collapsed="False" CollapsedSubGroup="False"/> <field name="SaleDate" caption="SaleDate" Width="0" Height="0" PopupWidth="120" PopupShowAvailable="False" Collapsed="False" CollapsedSubGroup="False"/> </fields> <page_fields alignment="taLeftJustify"> <fields/> </page_fields> <xaxis_fields alignment="taLeftJustify" GrandTotalPosition="fctp_Before" UseGrandTotalPositionFromMeasure="False" DefaultTypeSort="md_tsa_ByAxisValue" AxisType="at_Standard"> <fields/> <AdditionalGrandTotals/> </xaxis_fields> <yaxis_fields alignment="taLeftJustify" GrandTotalPosition="fctp_Before" UseGrandTotalPositionFromMeasure="False" DefaultTypeSort="md_tsa_ByAxisValue" AxisType="at_Standard"> <fields> <field name="SaleDate" caption="SaleDate" alignment="taLeftJustify" captionwidth="100" field_name="SaleDate" SortDirection="fcsd_Asc" TotalPosition="fctp_Before" UseTotalPositionFromMeasure="False"> <AdditionalTotals/> </field> </fields> <AdditionalGrandTotals/> </yaxis_fields> <measure_fields alignment="taLeftJustify" caption="Measures" CaptionWidth="100" Region="X" Position="0"> <fields> <field name="Qty" caption="Qty" alignment="taRightJustify" captionwidth="100" field_name="Qty" field2_name="Qty" fieldadv_name="Qty" AgrFunc="af_Sum" Visible="True" DisplayAs="da_Value" CalcAllCells="False" CalcAllCellsForTotals="False" Distinct="False" ChangeNullToZero="False" DefaultTotalPosition="fctp_After" UseDifferentAggForTotals="False" AgrFuncForTotals="af_Sum" CalcTotalsOnTotals="False" UseXAxisTotalsAsBase="False"> <display_format Version="2" Name="General"/> <HIGHLIGHTS/> </field> </fields> </measure_fields> <topn/> <selection col="0" row="0" measure="0"/> <sortselection xlevelindex="0" xindexinlevel="0" xmeasureindex="0" xadditionaltotalindex="0" ylevelindex="0" yindexinlevel="0" ymeasureindex="0" yadditionaltotalindex="0"/> <options HideColZeros="False" HideRowZeros="False"/> <groups version="2" timestamp="12.05.2017 16:31:09"/> <filters version="2" timestamp="12.05.2017 16:31:09"/> <charts version="2" timestamp="12.05.2017 16:31:09"> <chart_properties TypeChartData="tcd_ByAxisMeasures" CategoriesAxis="ar_RowAxis" SeriesAxis="ar_ColAxis" CategoriesFieldCount="1" SeriesFieldCount="1" MeasureFieldIndex="0" MarksShowStyle="ssNone" SkipNullPoints="False" Legend_Visible="True"/> </charts> </slice> |
As you can see, this is a simple XML file. Therefore, there will be no difficulties in understanding it.
The fields that we will get from the database are declared in the <fields> section.
The <xaxis_fields> section contains fields that will be displayed on the X axis. Similarly, the <yaxis_fields> section, only for the Y axis, is the same. Both the X axis and the Y axis contain measurement fields, depending on the orientation of the cube.
The section <measure_fields> contains fields-measures. This is all we need to know at the initial level.
Our task is to load this scheme into a cube and fill it with data from the database. The easiest way to explain how this can be done is by the example. Therefore, let's create a WindowsForms application.
Add libraries in the project references: FastReport.Olap, FastReport.Bars. They can be found in the folder with FastCube.Net installed: "C: \ Program Files (x86) \ FastReports \ FastCube.Net Professional".
"Drag" the following components to the form from the toolbox: cube, dataSource, dbDataSet, slice, sliceGrid, oleDbConnection, oleDbCommand.
![]()
Now you need to configure all these components. Let's start by connecting to the database.
In the oleDbConnection1 properties, set the ConnectionString value to "Provider = Microsoft.Jet.OLEDB.4.0; Data Source =" C: \ Program Files (x86) \ FastReports \ FastCube.Net Professional \ demo.mdb "
This is a demo database from FastCube.Net.
Proceed to the component oleDbCommand1. In its CommandText property, we write the following SQL query:
1 2 3 4 |
SELECT items.OrderNo, items.PartNo, items.Qty, orders.CustNo, orders.EmpNo, orders.SaleDate FROM (items LEFT OUTER JOIN orders ON items.OrderNo = orders.OrderNo) WHERE (items.OrderNo < 1100) |
For the dbDataSet1 component, you need to set the DbCommand property - oleDBCommand1.
And for DataSource1, select DataSet - dbDataSet1.
Now configure cube1. Choose DataSource - DataSource1. And SourceType is a DataSource.
For the slice1 component, we need to set only one property - the cube.
The sliceGrid1 component is the only visual component that we have added:
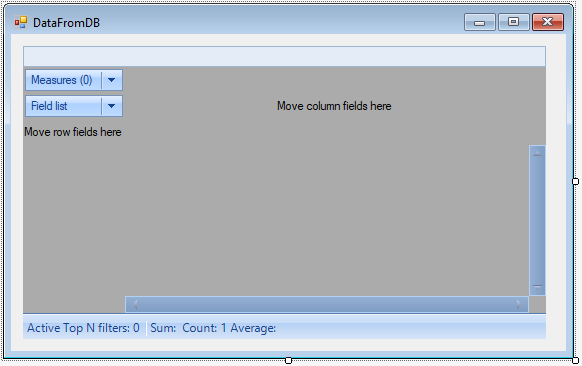
In its properties we set slice-slice1.
Unfortunately, we can not do without code. So let's create an OnLoad event handler for the form:
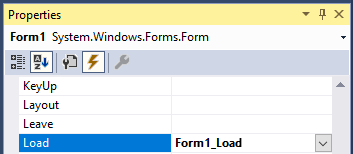
And add the following code:
1 2 3 4 5 6 |
private void Form1_Load(object sender, EventArgs e) { string filePath = "J:/Program Files (x86)/FastReports/FastCube.Net Professional/Demos/Data/Cubes/dataset_en1.mds"; cube1.Active = true; slice1.Load(filePath); } |
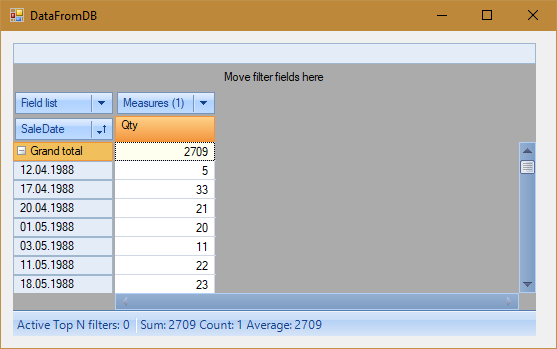
Here, we load a cube and a slice. You must activate the cube so that it loads data from the database. And now launch the application:
Thus, connecting a cube to a database is not difficult. The mds file with the scheme can be obtained by creating a cross-table view with your manually (by dragging the fields and making additional settings with the mouse), and then saving it with the slice.Save () method or clicking the "Save" button on the cross-tab toolbar.scheme