Components of FastCube .NET. Part 2. Chart, DataSource
In the first part of the article, we looked at the components for data analysis - a cube and a slice. In the second section, the components from the database or DataTable will be presented, as well as the slice diagram.
1. The Chart component is a graph based on the data from the slice. It is built automatically, just set the property of Slice.
Properties:
|
Property |
Description |
|
SeriesType |
Chart type (columnar, circular, etc.) |
|
SkipNullPoints |
Ignore empty points in the diagram |
|
BaseAxisDataType |
Base axis data type |
|
MeasureFieldIndex |
Field index of the measure |
|
SeriesFieldCount |
Number of fields in a series |
|
CategoriesFieldCount |
Number of category fields |
|
SeriesAxis |
Axis of the series. Contains columns and lines. |
|
CategoriesAxis |
Axis of categories. Contains columns and lines. |
|
DataType |
The way data is presented in the diagram. |
|
Slice |
Link to slice object |
|
Legends |
Legends - names of data series (graphs) |
|
ChartAreas |
Areas of the graph |
|
Frozen |
Freezing allows you to fix the state of the chart, so that subsequent changes in the cut will not be reflected on it |
Methods:
|
Method |
Description |
|
BeginUpdate() |
Enable editing mode |
|
EndUpdate() |
End editing |
|
Load(XmlItem item) |
Load chart settings from the cube file |
|
Save(XmlItem subItem) |
Save the graph settings to a cube file |
Setting the Chart component is to select the available slice in the Slice property.
To create and customize the Chart object in the application code, use the following code:
1 2 3 4 |
Chart chart = new Chart(); chart.Dock = DockStyle.Fill; chart.Parent = tabPage3; chart.Slice = slice1; |
In this case, we need to create an object, configure its display, bind to the parent object, and specify the slice.
2. The ChartToolbar component contains tools for customizing the chart display.
![]()
Composition:
1) Chart style:
- Bar;
- Line;
- Point;
- Area;
- Pie;
- Horiz Bar.
2) Frozen chart – freeze the current state of the chart;
3) Chart properties – chart properties in a separate window;
4) Marks;
5) Legend;
6) Copy - copy the diagram as a picture.
Properties:
|
Property |
Description |
|
Chart |
The Chart object for which this toolbar is active |
When setting up the visual component, you need to set the Chart property, which is the chart to which the toolbar will be attached.
Customization from application code:.
1 2 3 4 |
ChartToolbar chartToolbar = new ChartToolbar(); chartToolbar.Dock = DockStyle.Top; chartToolbar.Parent = tabPage3; chartToolbar.Chart = chart; |
3. The DataSource component is the data source for the cube.
Properties:
|
Property |
Description |
|
DataSet |
Data Set - DBDataSet or DTDataSet |
|
Fields |
List of data source fields |
Methods:
|
Method |
Description |
|
AddFields() |
Load cube fields from the data source |
|
Check(StringBuilder msg, bool skipFieldsWithErrors) |
Check fields for duplication |
|
Close() |
Resets the data source to zero |
|
DeleteFields() |
Clears the list of fields for the cube |
|
InitFields(bool loaded = false) |
Initializing Fields |
|
Open() |
Open Data Source |
In the settings of this component, you need to define a data set. This can be a DBDataSet or a DTDataSet.
Below, for the listed components, the configuration from the application code of the entire data acquisition chain will be shown.
4. DBDataSet - a data set for the DataSource, obtained from the database.
Properties:
|
Property |
Description |
|
DbCommand |
The command for the database that contains the SQL query |
Configuring the connection of the cube to the database:
1) Using visual components:
To configure a data connection via DBSataSet, you need to generate DBCommand using the oleDBCommand component. In turn, for the oleDBCommand component, you must specify a connection to the database using the oleDBConnection component.
To configure the connection to the database, the following components are required:
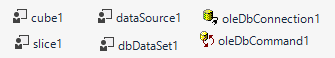
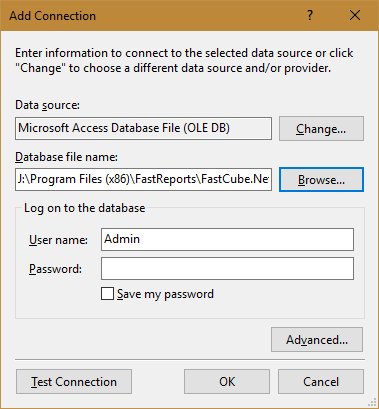
- Setting up oleDbConnection:
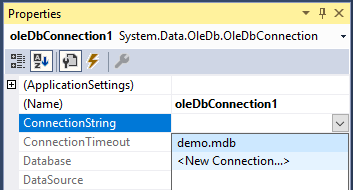
Create a new connection:
- Setting up oleDBCommand:
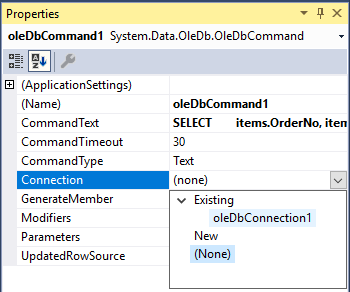
You should specify the command - sql query. And also, you need to select a data connection.
• Setting up the cube:
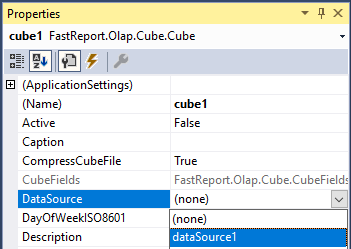
2) From the application code:
1 2 3 4 5 6 |
OleDbCommand command = new OleDbCommand(); command.CommandText = "Select * from Sales"; dbDataSet1.DbCommand = command; dataSource1.DataSet = dbDataSet1; cube1.DataSource = dataSource1; cube1.Open(); |
5. DTDataSet is the data set for the DataSource that is received from the DataTable. In turn, DataTable can be filled with data from the database, text file, application code.
Properties:
|
Property |
Description |
|
DataTable |
Reference to the table |
The procedure for setting up a connection to the DataTable using visual components is very simple.
Configuring a Cube to a DataTable:
1) Setting up visual components is similar to setting up a database connection, the only difference is that in the DataSet configuration for the DataSource component, you need to select dtDataSet1. Accordingly, oleDBConnection and oleDBCommand are not required.
2) From the application code:
1 2 3 4 5 6 7 |
DataTable dataTable = new DataTable(); // Create a table and fill it with data … cube1.Close(); // Close the cube to unload the data from it (if previously loaded) dtDataSet1.DataTable = dataTable; // For the data set, we assign the created table to the DataTable property dataSource1.DeleteFields(); // Clear the fields in the data source (if previously loaded) dataSource1.DataSet = dtDataSet1; cube1.Open(); // Open the cube to load the data into it |