Manage the size of the band in the designer with the mouse
Most of the time when developing a report, it takes away the placement of elements on the page. Very few people manage to pick up the sizes and proportions from the first time. You always have to do a couple of test runs of the report.
The new function of controlling the height of the band is designed to speed up development. The feature of the function is that at the same time it is possible to remove all free space above and below the object on the band.
The easiest way to show an example. In the blank report, add several fields from the data source to the “Data” band:
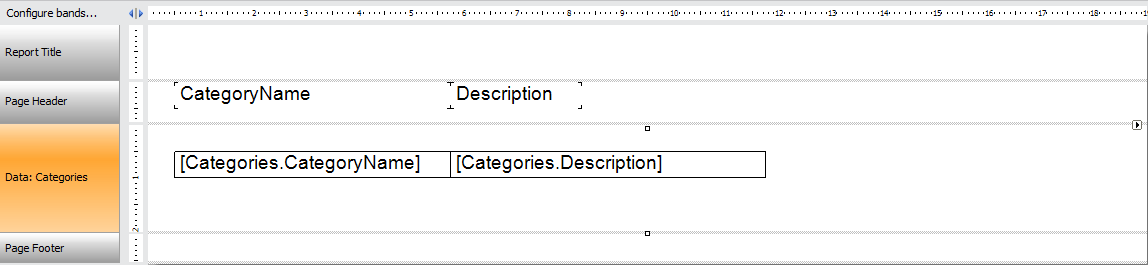
As you can see, above and below the added fields there is free space. To fix this you need to highlight the two added fields and drag them up, and then reduce the size of the band by pulling at its bottom edge. This way we would have done before. There are quite a lot of actions.
Now everything can be made easier. We click on the free space of the “Data” band, thereby selecting it. White squares which you can pull appear on the upper and lower border. If you pull the bottom - you can increase or decrease the size of the band. You can reduce the size only to the nearest object on the band.
Let's try to pull the top square down.
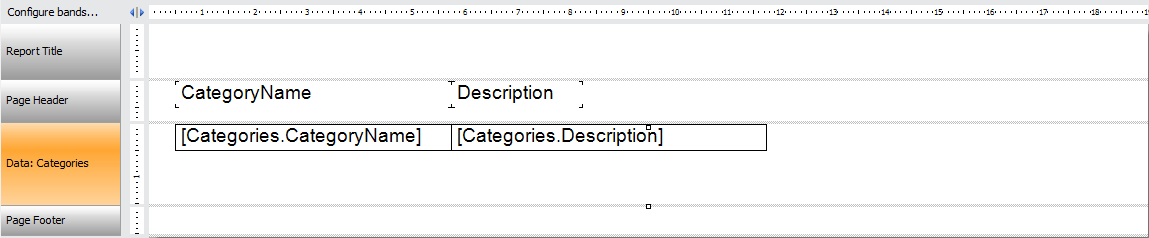
At the same time, the free space above the objects will decrease. But, as soon as the objects reach the upper boundary of the band, the space below the objects will begin to decrease as well.
Continuing to pull down, we remove all the free space under the objects.

Thus, we will achieve the desired result with just two actions. Much more convenient than before, isn’t it?
You probably wonder what will happen if you pull up the top square. The free space above the object will increase.