Como criar um campo calculado em uma matriz a partir de um script de relatório FastReport .NET
Matrix reports are very popular. Typically, the matrix, or otherwise summary tables are used in the accounting and statistical reporting. Let's determine what a summary table is.
A summary table is a software tool that allows you to reorganize and summarize the selected columns and rows of data in a table to obtain the required report. The summary table is especially useful for a large amount of data.
For example, you are running a small business like stationery store. You would like to know what products have the best selling rate, or what are the sales leaders this month. Having a lot of statistical data is quite laborious to analyze them. Here on the help comes a summary table, which combines data for a certain period in one table.
The main operation in the processing of data for creating a summary table is the summation. But, sometimes, you may need your own function to calculate some columns, such as totals. Let's have a look at the example of the way to add a calculated field to a matrix using the report script. Create a report and add the matrix object to the "Data" band. As you remember, to create a column, a drain or a cell, you need to drag the expression to the corresponding area. The expression can be: data field, function, variable, total. In general, any object from the data panel. If you are going to fill the matrix from the report's script, then add any expression to the matrix, and then open it for editing and clean it, or enter a number. This is the template of the matrix:
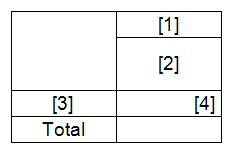
To add fields to the matrix programmatically, you need to create an AfterData event handler for the matrix.
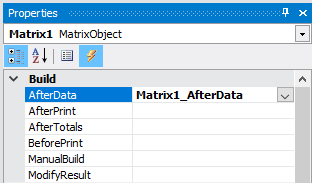
Let's move on to the report script. In the generated handler, add the columns to the matrix:
1 2 3 4 5 6 7 8 9 |
Matrix1.AddValue(new Object[] { "Accruals", "Salary" }, new Object[] { "1" }, new Object[] { 1000}); Matrix1.AddValue(new Object[] { "Accruals", "Bonus" }, new Object[] { "1" }, new Object[] { 500}); Matrix1.AddValue(new Object[] { "Accruals", "Penalty" }, new Object[] { "1" }, new Object[] { 200}); Matrix1.AddValue(new Object[] { "Accruals", "Total" }, new Object[] { "1" }, new Object[] { 0}); Matrix1.AddValue(new Object[] { "Accruals", "Salary" }, new Object[] { "2" }, new Object[] { 500}); Matrix1.AddValue(new Object[] { "Accruals", "Bonus" }, new Object[] { "2" }, new Object[] { 300}); Matrix1.AddValue(new Object[] { "Accruals", " Penalty" }, new Object[] { "2" }, new Object[] { 250}); Matrix1.AddValue(new Object[] { "Accruals", "Total" }, new Object[] { "2" }, new Object[] { 0}); |
Note that the structure of column headers is given by enumeration of names - "Charges", "Salary". In our case, the general header "Charges" has 4 subheadings (). Next, we create a row with heading 1. The third parameter is the value of the data cell new Object [] {1000}.
We added two rows of data. The Total field has a value of zero. Now we need to set a value for it. We pass through all rows of the matrix in a loop and set the value for the result:
1 2 3 4 5 6 |
int[] rowIndices = Matrix1.Data.Rows.GetTerminalIndices(); for (int i = 0; i < rowIndices.Length; i++) { rowIndex = rowIndices[i]; SetValue("Accruals;Total", GetValue("Accruals;Salary") + GetValue("Accruals;Bonus") - GetValue("Accruals;Penalty")); } |
Add the rowindex variable to the class:
private int rowIndex;
Note the SetValue and GetValue methods. Add them to the class:
1 2 3 4 5 6 7 8 9 10 11 |
private void SetValue(string complexValue, float value) { int columnIndex = Matrix1.Data.Columns.Find(complexValue.Split(';')); Matrix1.Data.SetValue(columnIndex, rowIndex, value); } private float GetValue(string complexValue) { int columnIndex = Matrix1.Data.Columns.Find(complexValue.Split(';')); return new Variant(Matrix1.Data.GetValue(columnIndex, rowIndex, 0)); } |
From the headings it is clear that one method is to get the value of a cell, and the second is to change.
Run the report:
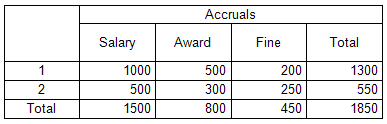
So we calculated the total for each row of data.