logo
small logo
  • Products
  • Buy
  • Support
  • About
  • Customer panel Support
    • en
    • de
    • JP
    • ZH
  • Home
  • /
  • Articles
  • /
  • How to select the top values in a matrix
  • How to sort similar matrices through one-dimensional array on several pages in FastReport .NET

    September 22, 2021

    Let's say we have the task: to sort the matrix on the first page in

    read more
  • How to filter the built matrix

    June 23, 2021

    In FastReport, the Matrix object allows us to filter data. This is one of the

    read more
  • Comparison of SSRS and FastReport .NET part 1

    November 18, 2017

    Electronic and printed reporting is used in many areas of our life. Can you imagine

    read more
  • New features and comparison of Matrix and AdvancedMatrix objects

    March 23, 2022

    More recently, the AdvancedMatrix object was implemented in FastReport .NET. In this article, we

    read more
  • How to make an interactive report with toggle sorting

    June 2, 2021

    Occasionally, our users face the task of making an interactive report. It may be

    read more

How to select the top values in a matrix

April 22, 2021

The article is relevant until version 2022.1.

FastReport .NET has a great tool for displaying data as an integrated table or matrix. Many of us would like to improve the functionality of matrices, for example, with such a useful option as a choice of N top values. It seems as simple as selecting the N top lines from a data source. However, besides making a selection of the top values, it is necessary to group all the rest data into a single recording, which is the main problem. This cannot be done with the built-in tools of the Matrix object.

Thus, we have to prepare the data so that they contain both the top values and the sum of all the rest values. This means is suitable for SQL databases. Everything we need is to write an SQL query.

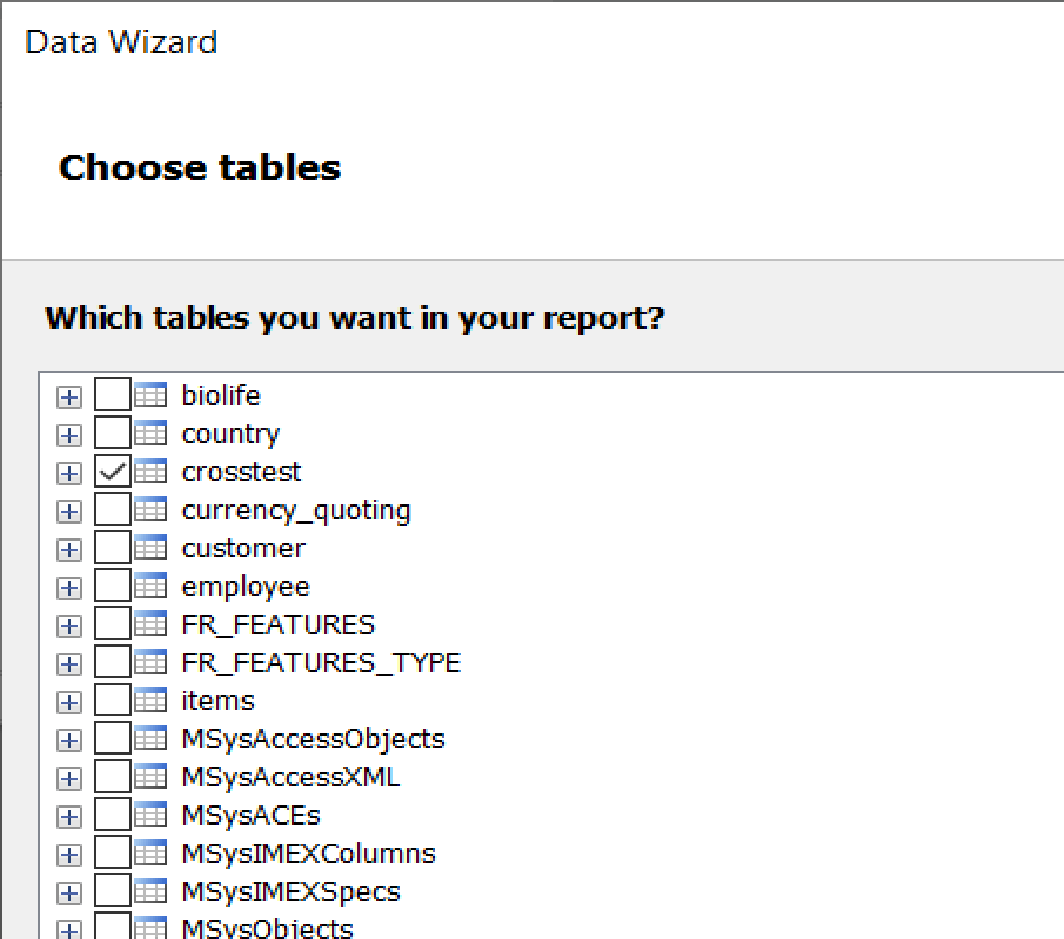
Assume we produce a list of employees’ wages by years. In the data source editor, we may use an SQL query, if an SQL database is used.

Data processing wizard

This is how the SQL query, which will select 2 top values and the sum of all the rest values, will look like:

SELECT top 2 name, year, month, salary FROM crosstest ORDER BY salary
UNION
SELECT 'Other' AS name, year, month, SUM(salary) FROM crosstest
WHERE name NOT IN (SELECT Top 2 name FROM crosstest ORDER BY salary)
GROUP BY name, year, month

Here we combine two queries with a union operator. In the first query, we choose the top values, in the second query — the sum of all remaining values.

As a result, we obtain the following matrix:

Final result

As you can see, by using various techniques of preparing initial data, we can obtain the desired effect, even if such functionality had not been initially provided in the report generator.

about product buy
avatar
Dmitriy Fedyashov
Technical Writer
Fast Reports Team: Dmitriy Fedyashov - Technical Writer at Fast Reports
.NET FastReport SQL Filtering Matrix

Add comment
logo
  • 800-985-8986 (English, US)
  • +4930568373928 (German)
  • +55 19 98147-8148 (Portuguese)
  • info@fast-report.com
  • 901 N Pitt Str #325 Alexandria VA 22314
  • Buy
  • Download
  • Documentation
  • Testimonials
  • How to uninstall
  • FAQ
  • Tutorial Video
  • Forum
  • Articles
  • Our News
  • Press about us
  • Resellers
  • Extended licensing
  • Contact us

© 1998-2023 by Fast Reports Inc.

  • Privacy Policy