With a great variety of document formats, often can be a situation when the customer wants to use some kind of document formats they already have and don't waste time on creating the same layout in the report. For those cases, FastReport VCL provides the ability to use RichText or HTML tags in the text object, but sometimes this is not enough.
Starts with FastReport VCL 2021.2 we extend a set of tools for text formating.
The new HTMLView object can load HTML4 with CSS styles and use it along with expressions inside a report, data fields linking, and other powerful abilities of FastReport VCL.
Let's check step-by-step how to use "HTMLView" in a report. First of all, we have to add an object package to an application. For this, we need to simply put "TfrxHTMLObject" on the application form or add frxHTML module to the uses clause of the application.
Now when the object is registered we can use it from the Run-time report designer.
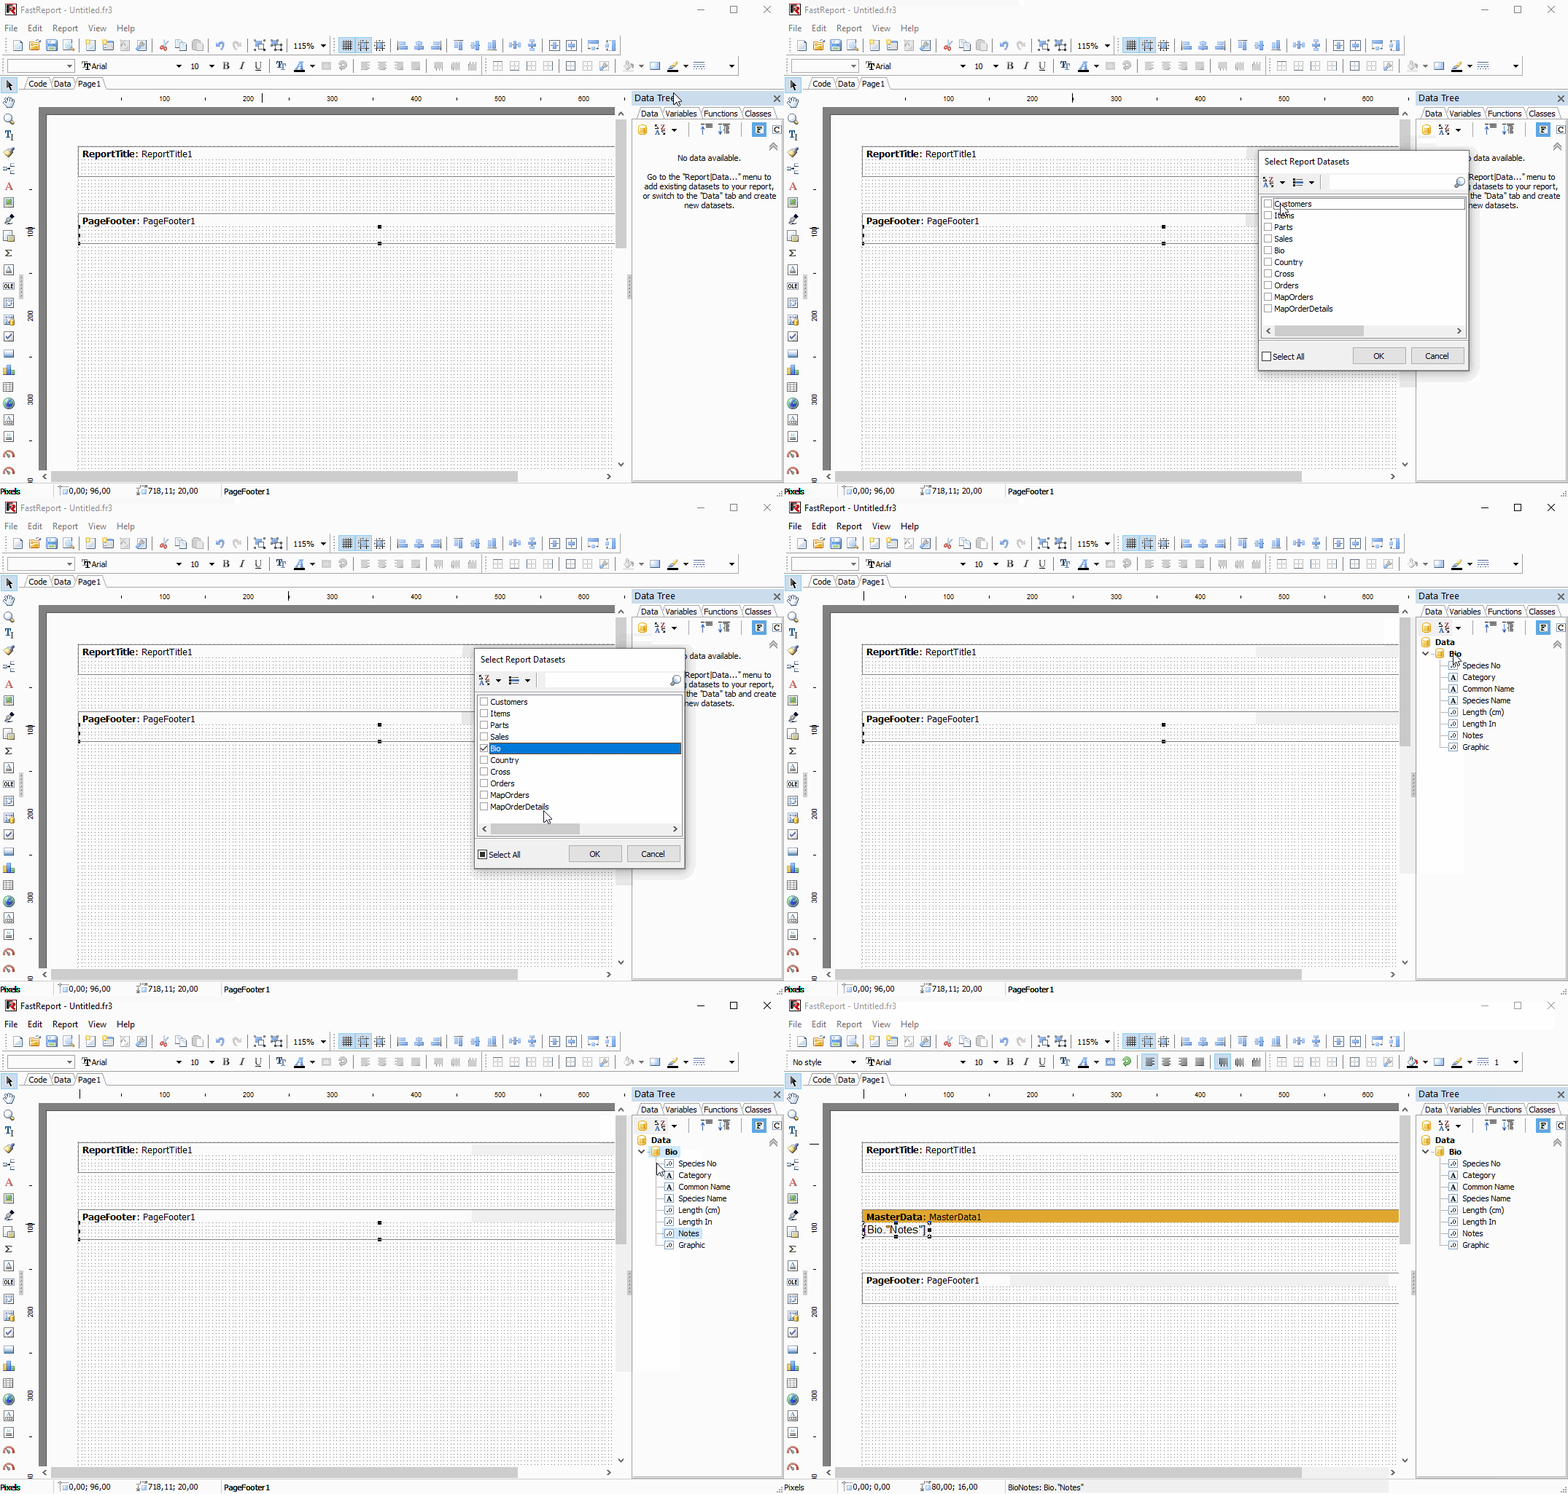
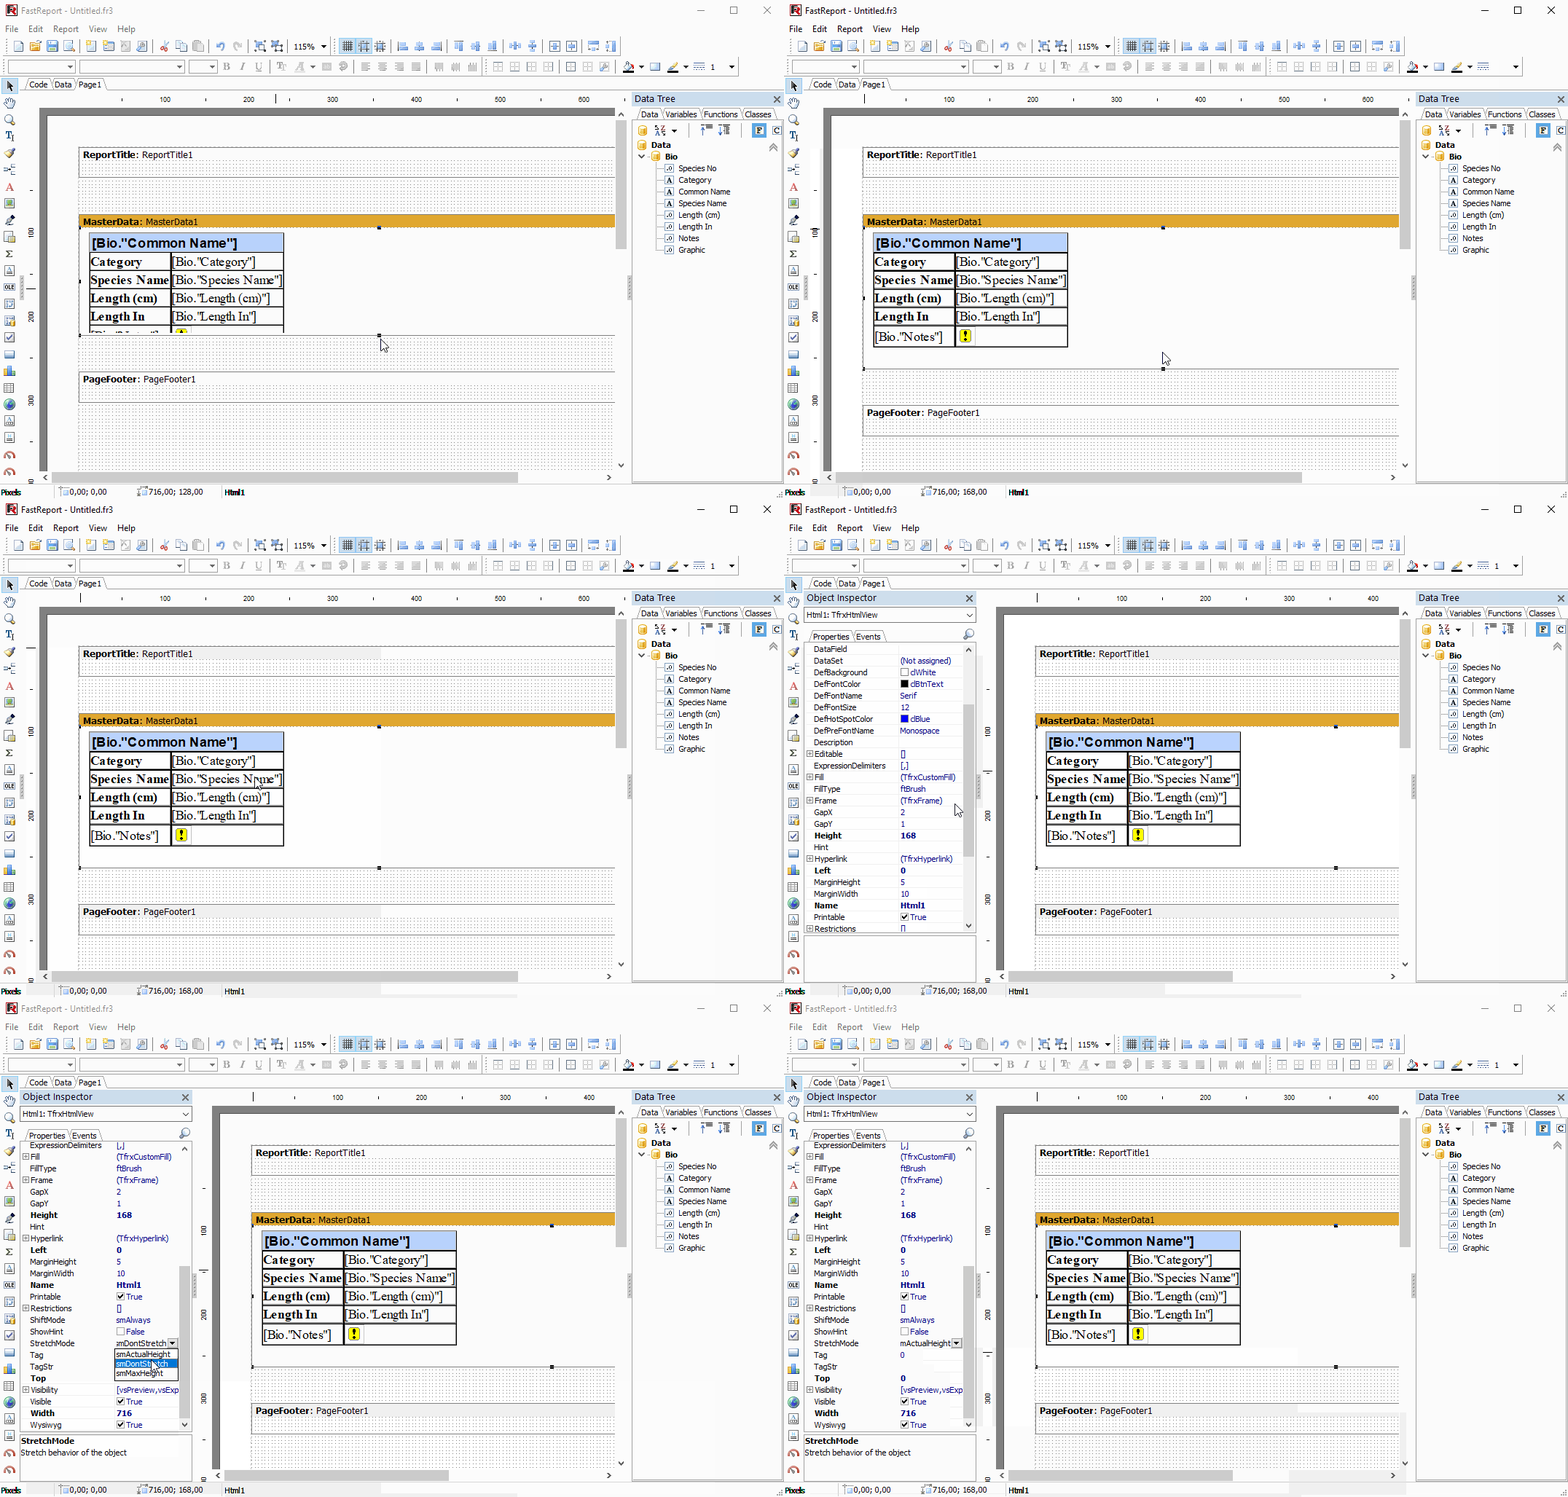
Let's run the report designer. First, we have to choose the data we want to use. In this article, we're going to use the Biolife table from the standard database (Main Demo). The report will output fishes data with images.
Connect to dataset
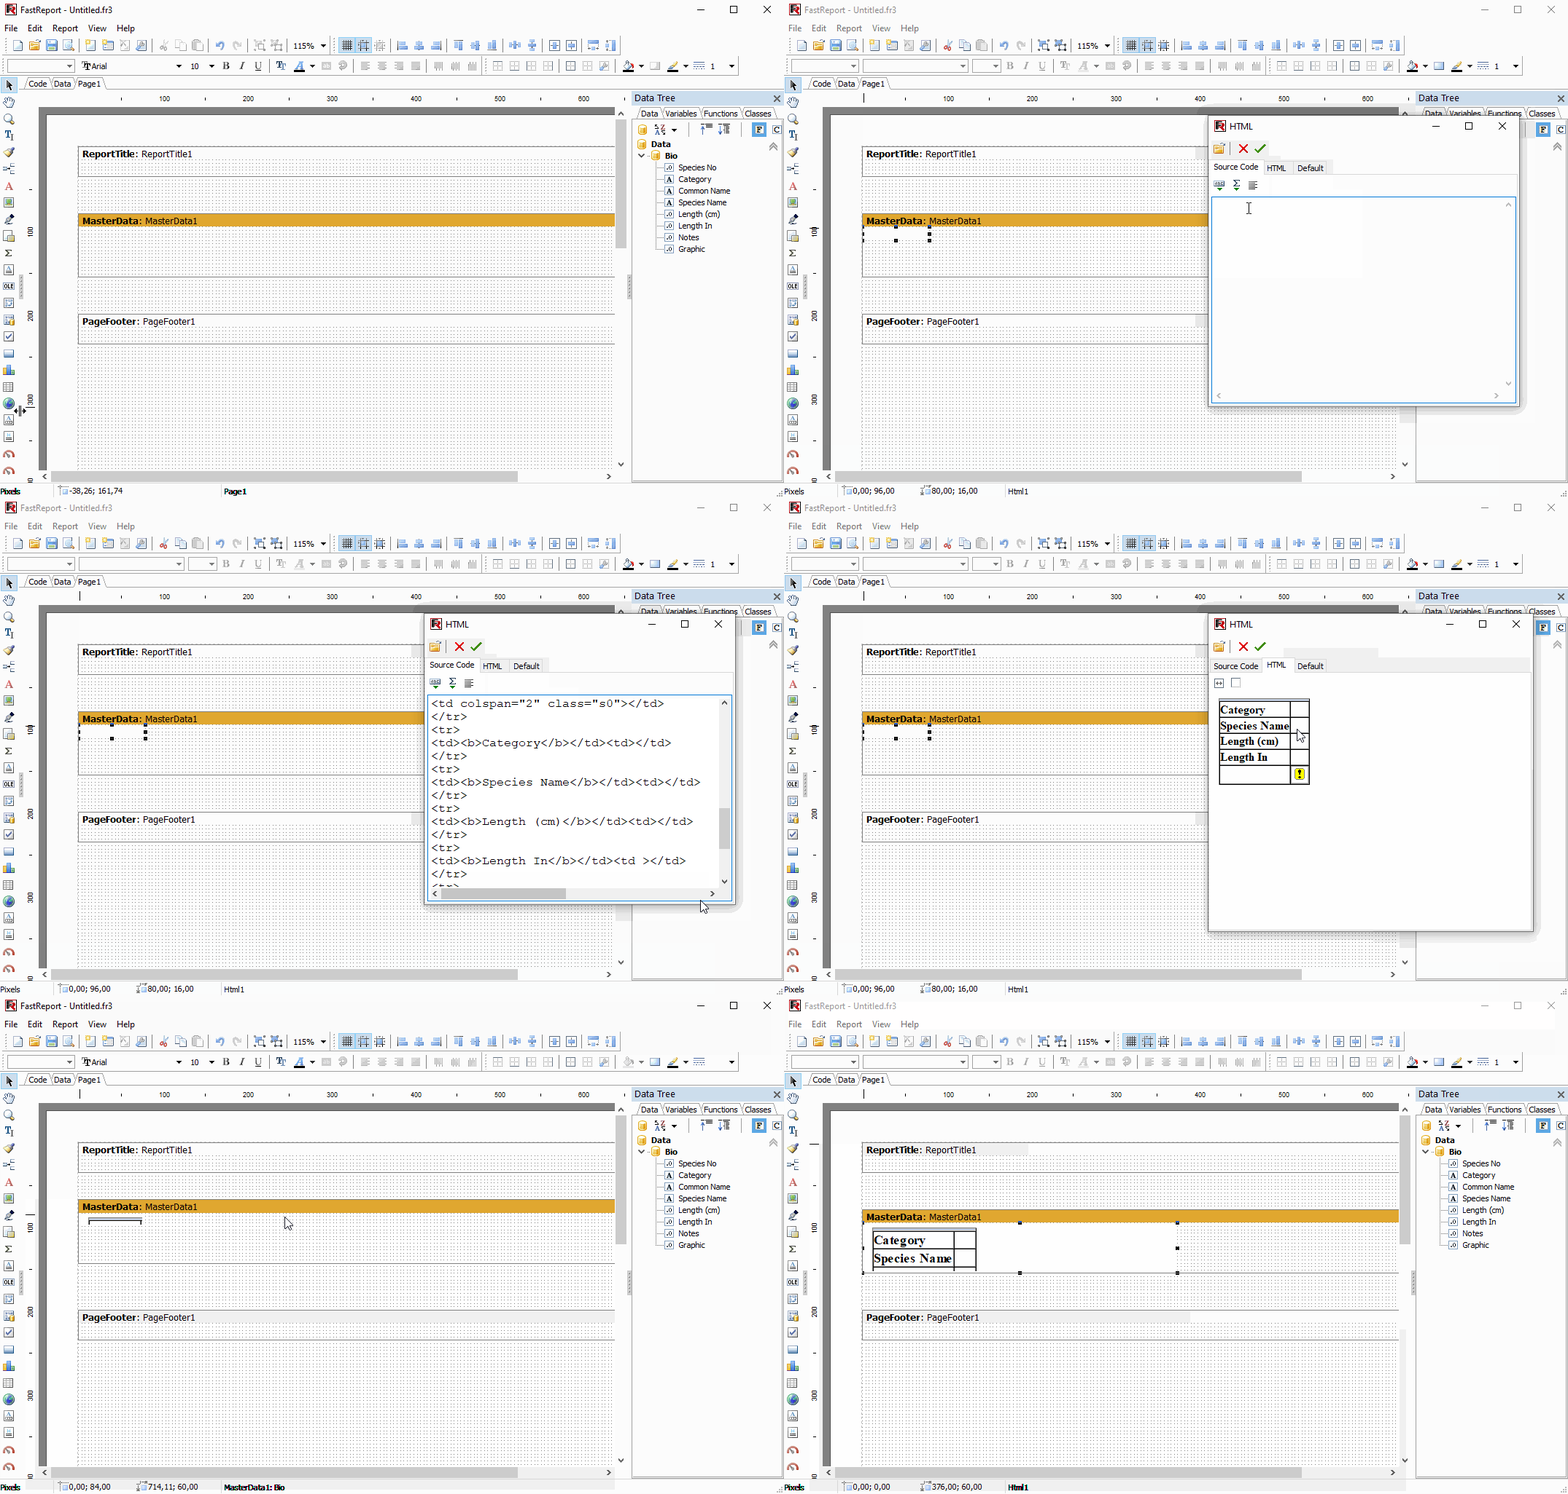
Now we can place "HTMLView" from the report object palette on created Data band now.
In our case, HTML code was created before and inserted through the clipboard. It's possible to load HTML code from a file as well. The code should contain only HTML4.0 and CSS (JavaScript and others Web extensions are not supported).
For the best layout of data inside HTML code, we are using a table that has all the data fields we need.
| HTML Example | |
1 2 3 4 5 6 7 8 9 10 11 12 13 14 15 16 17 18 19 20 21 22 23 24 25 26 27 28 29 30 31 32 33 34 35 36 37 38 39 40 41 42 43 44 45 46 47 48 49 50 51 52 53 54 55 56 57 |
<!DOCTYPE html> <html> <head> <meta charset="utf-8"> <style> .t1{ table-layout: fixed; } .c1{ word-wrap:break-word; } .rightimg { float: right; margin: 7px 0 7px 7px; } .s0 { font-family: Arial; font-size: 16px; color: #000000; font-weight: bold; font-style: normal; background-color: #BAD3FE; border-left-color:#C0C0C0; border-left-style: solid; border-left-width: 1px; border-right-color:#C0C0C0; border-right-style: solid; border-right-width: 1px; border-top-color:#C0C0C0; border-top-style: solid; border-top-width: 1px; border-bottom-color:#C0C0C0; border-bottom-style: solid; border-bottom-width: 1px; text-align: Left; vertical-align: Top; padding-top: 1px; padding-left: 2px; } </style> </head> <body> <table class="t1" border="1" cellpadding="0" cellspacing="0"> <tbody> <tr> <td colspan="2" class="s0"></td> </tr> <tr> <td><b>Category</b></td><td></td> </tr> <tr> <td><b>Species Name</b></td><td></td> </tr> <tr> <td><b>Length (cm)</b></td><td></td> </tr> <tr> <td><b>Length In</b></td><td ></td> </tr> <tr> <td class="c1"><span style="max-width:150px;"></span></td> <td><img src=""></td> </tr> </tbody> </table> </body> </html> |
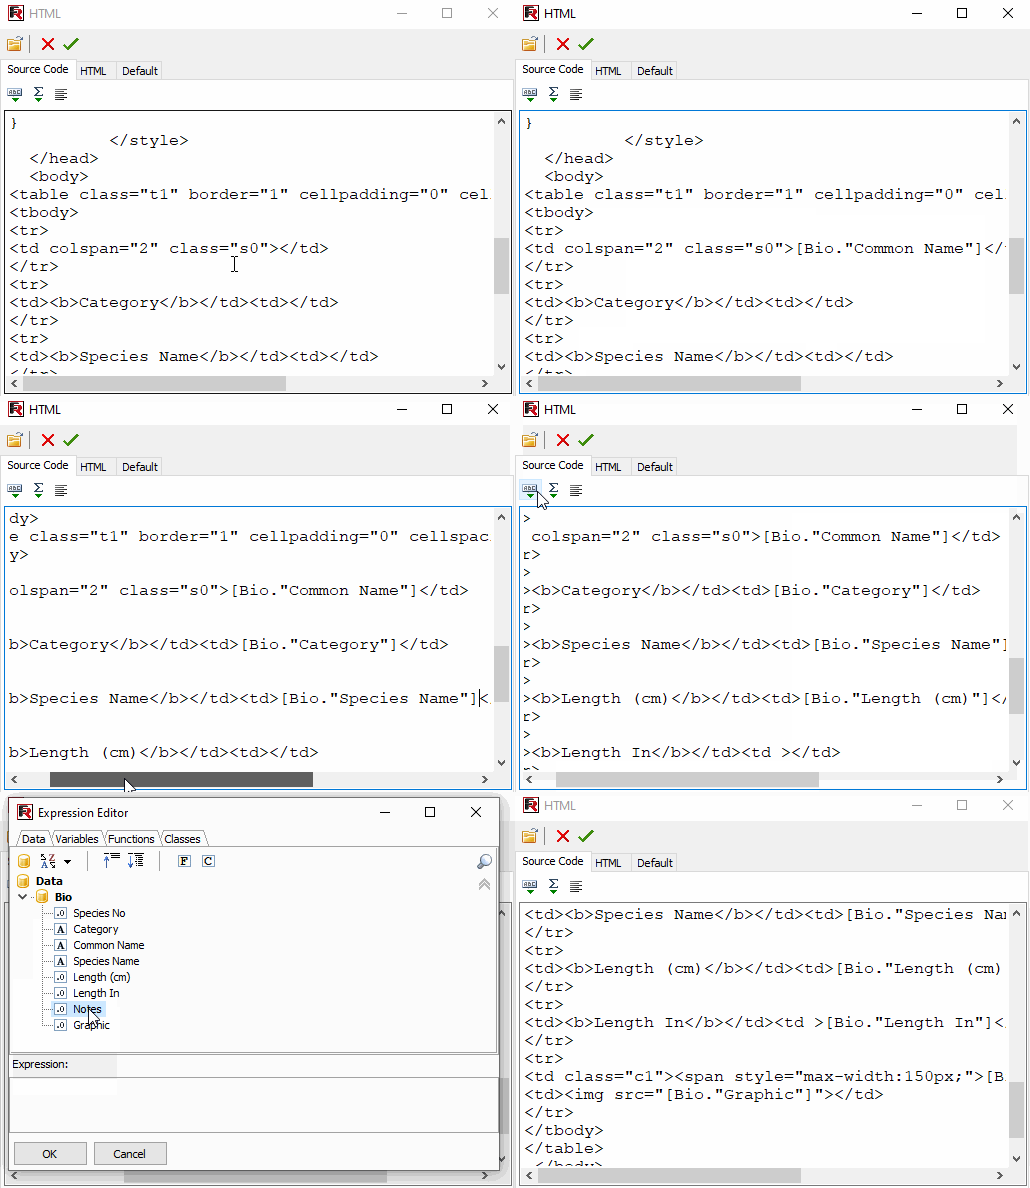
Now to link our HTML code with data fields just use the object editor with expression editor and insert data expressions.
The image data field will be automatically encoded to base64 with the correct mime-type of images stored in the database. FastReport VCL will do that automatically.
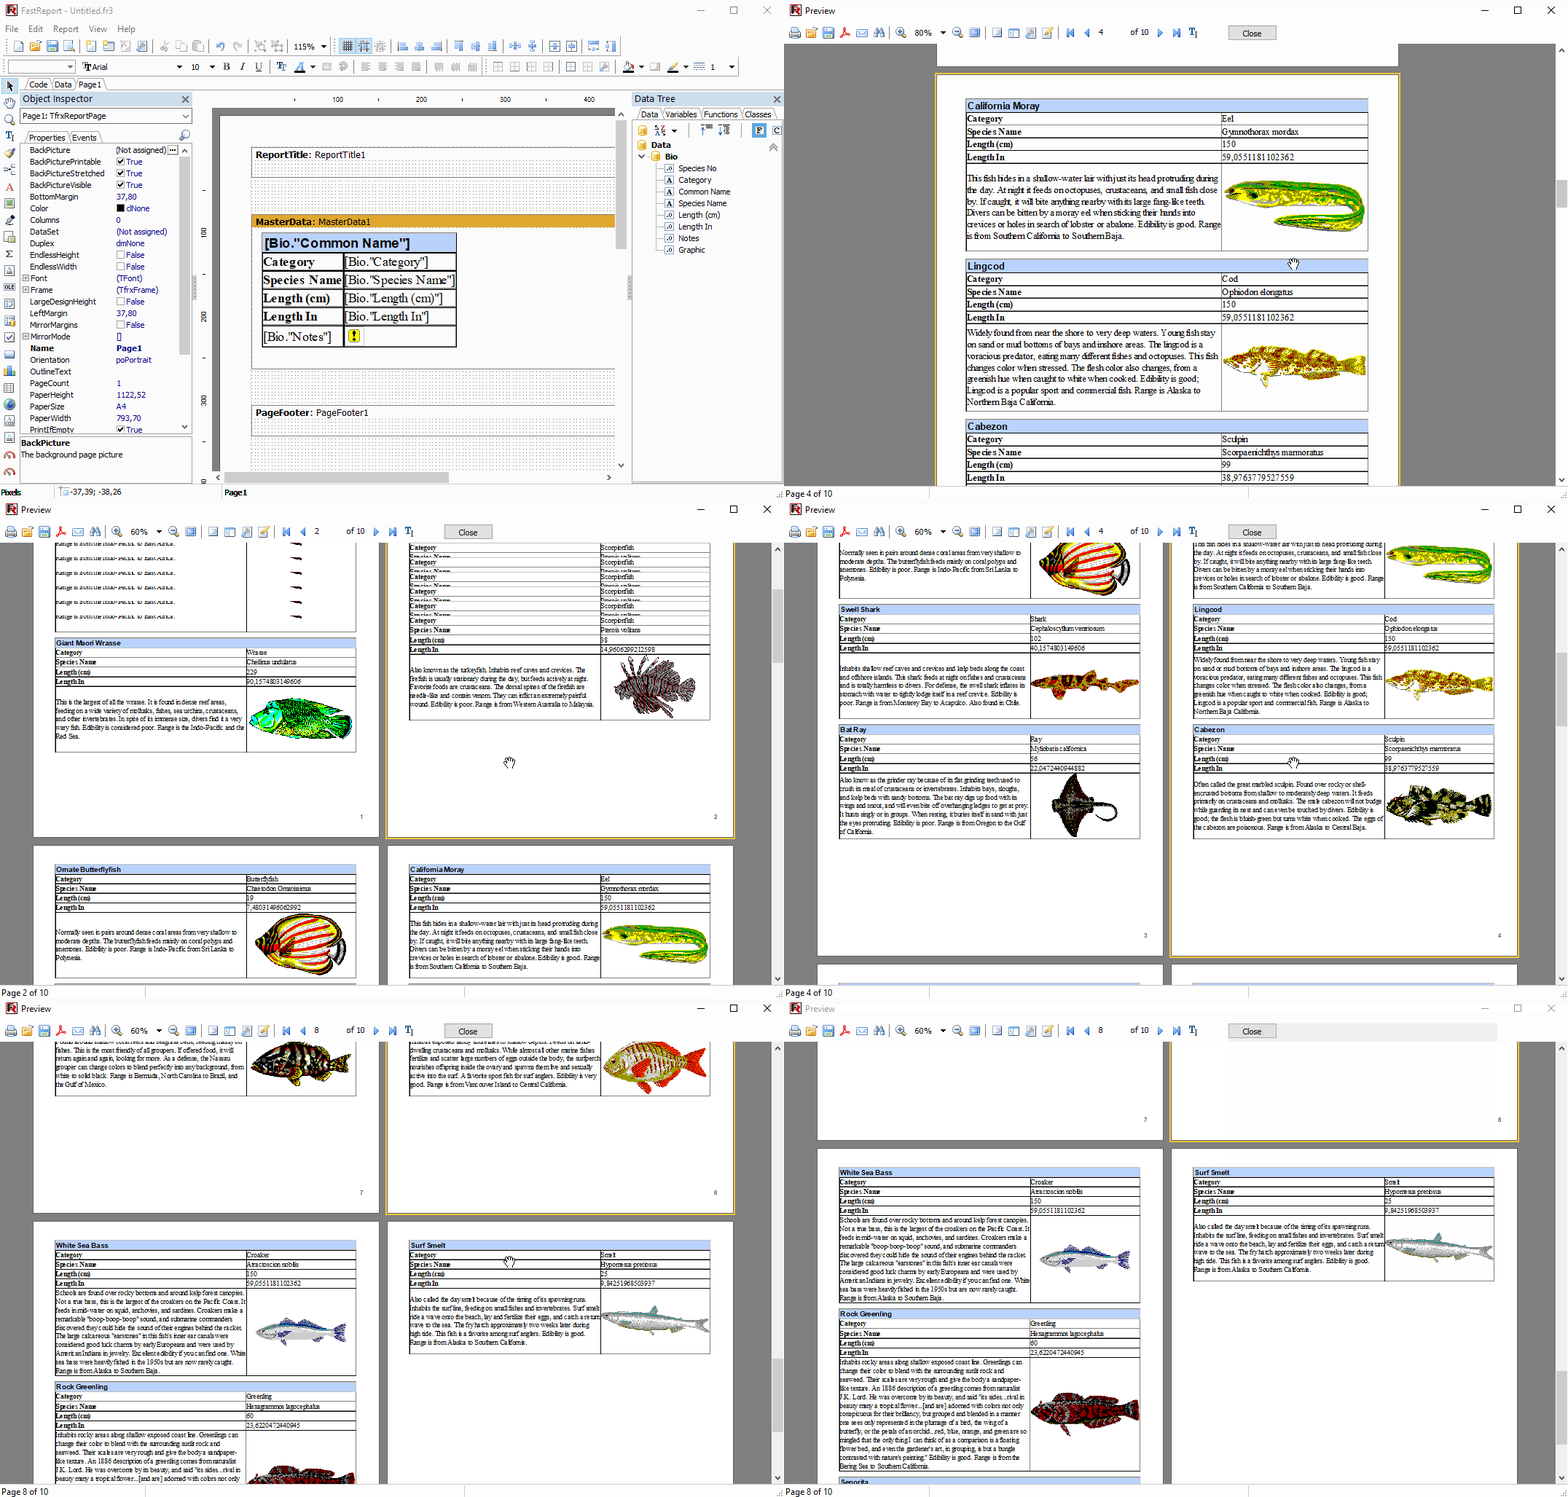
The "HTMView" object supports grow to the bottom(stretch) relative to the content inside it just like the "RichText" object. And of course, "HTMLView" object supports data split when the report page doesn't have enough free space. A data stretch and data split can be activated like in other report objects of FastReport VCL. First, we need to set Stretched and AllowSplit properties of the band. Then set StretchMode property of the "HTMLView" object to smActualHeight in our case.
That's all! Just run the report and check the result.
As can be seen use HTML4.0 and CSS with links to the data is very easy in the new version of FastReport VCL 2021.2.


