How to use an SVG object in FastReport .NET
Sadly, the issue of vector graphics in FastReport.Net has been poorly worked out. In the designer there is a small set of figures and polygons, but there is no information on how to use files with vector graphics. Quite recently a plug-in for the report designer has appeared. It adds a new SVG object to the component palette. Now you can use any vector drawings in SVG format in your report.
Now let us learn what SVG format is. This abbreviation (SVG) stands for Scalable Vector Graphic. SVG is a vector graphics markup language that is based on xml. The use of xml immediately provides popularity to this format. Here is a simple SVG file with lines, if you open it with a text editor:
1 2 3 4 5 6 7 8 9 10 11 12 13 14 15 16 17 |
<?xml version="1.0"?> <svg xmlns="http://www.w3.org/2000/svg"> <rect x="20" y="20" width="300" height="250" style="fill:none;stroke:blue;stroke-width:2"/> <g style="stroke:green;"> <line x1="50" y1="200" x2="100" y2="60" style="stroke-width:5; stroke-linecap:round;" /> <line x1="100" y1="200" x2="150" y2="60" style="stroke-width:10; stroke-linecap:butt;" /> <line x1="150" y1="200" x2="200" y2="60" style="stroke-width:15; stroke-linecap:square;" /> <line x1="200" y1="200" x2="250" y2="60" style="stroke-width:20; stroke-linecap:round;" /> <line x1="250" y1="200" x2="300" y2="60" style="stroke-width:25;" /> </g> </svg> |
Such an XML document can describe polygons, drawings or a text.
SVG allows to create animated and interactive graphics using JavaScript and CSS. Unfortunately, in FastReport this is not available yet.
The main advantages of SVG format are:
1) Simplicity of understanding of structure, and hence the ease of creation;
2) A small file size;
3) Scalability;
Let us now examine how to add an SVG object to the report designer. To do this, open the project in the \ FastReport.Net \ Extras \ Misc \ SVGObjectPlugin folder. In this case, the nuget package manager downloads updates. We let us build a solution.
Open the report designer. In the File menu, use the icon  to open the designer's settings:
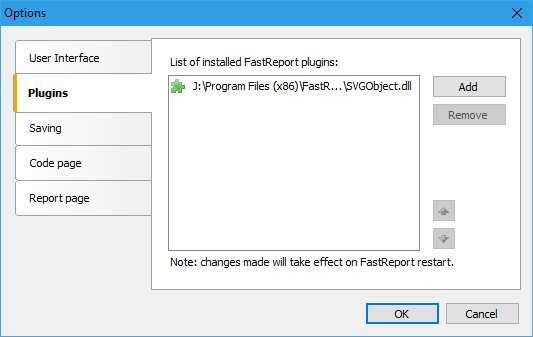
On the "Plugins" tab add the library that has been created. It is located here:
FastReport.Net\Extras\Misc\SVGObjectPlugin\SVGObject\bin\Debug\SVGObject.dll.
Click "OK" and restart the designer. Now, at the very bottom on the component panel on the side there is one more element:  .
.
Drag it to the report page and work with it like with the "Picture" object. Double-clicking on it opens the editor:
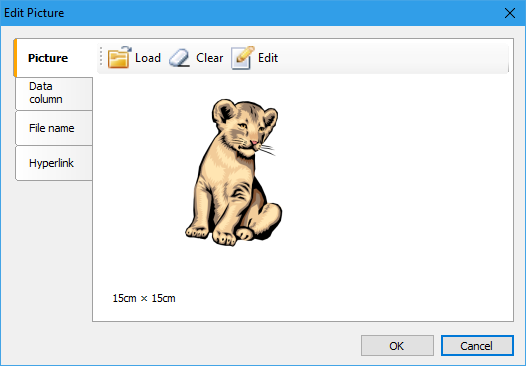
Using the "Open" button we load the SVG file. As one can see from the tabs, the file can be downloaded from different sources: a local disk, a database, by a hyperlink. This is it. Now you can stretch the image without losing quality:
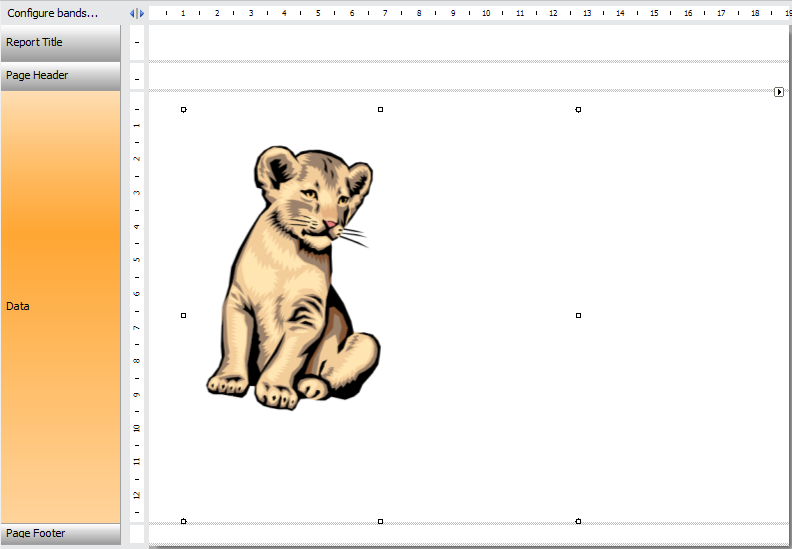
Using SVG files extends the use of FastReport.Net in print business.
We wish developers not to stop at their oars and gladden us with the opportunity to use animated SVG in web reports.