The "Chart" object
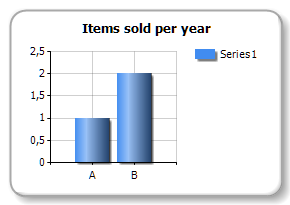
The "MS Chart" object allows to display charts. There are more than 30 different series types available - bars, columns, areas, lines, bubbles, pie, circular, financial, pyramidal, ranges. The object looks like this:
You can learn more about this object in the "Report creation" chapter.
The "Chart" object has the following properties:
| Property | Description |
|---|---|
| Chart | Reference to Microsoft Chart object. |
| AlignXValues | This property allows to align X values in different chart series (by inserting empty values). It is used if the chart contains two series or more. |
| AutoSeriesColumn, AutoSeriesColor, AutoSeriesSortOrder | These properties allows to set up automatically created series. Read more about this in the "Report creation" chapter. |
| DataSource | The property allows connecting the chart to the data source. |
| Filter | This property contains expression for data filtering which will be applicable to data source of the chart (see DataSource property). |