Setting up auto-series
You can set up the chart so it will create new series automatically, depending on data in a data source. To set up auto-series, do the following:
- create one series and set up its properties. This series will be used as a template for all new series;
- select "Chart" object and set up the auto-series data column. The value of this column will be a name of new series. If there is no series with such name yet, the new series will be added.
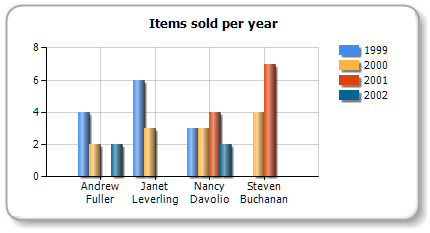
Let us demonstrate how to create auto-series. We will use the MatrixDemo data table to get a chart of employee's sales per year. One series will represent one year. To do this:
- connect the chart to the MatrixDemo data source;
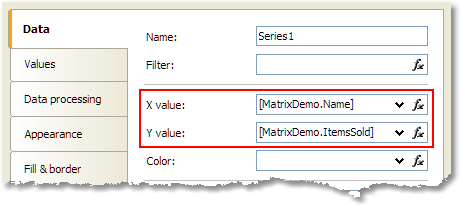
- create one series and set up its data:
- on the "Data processing" tab, check the "Group by X value" checkbox. It is necessary because our data source has several employees with the same name;
- select the chart in the series list and set up its auto-series column on the "Data" tab:
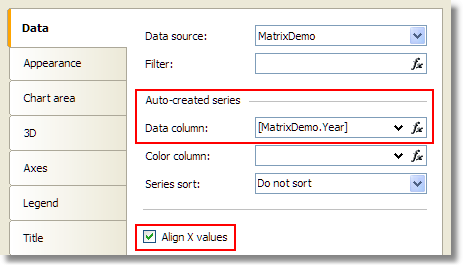
- our series may have different number of values (because some employees do not have sales in this particular year). To align series values, check the "Align X values" checkbox.
We will get the following result: