When using layer type “geodata from an application”, the data is displayed as a small circle with a caption. The size of the circle can be bound to the data in the same way as highlighting data using colors. To do this set up the size ranges on the "Size ranges" tab:
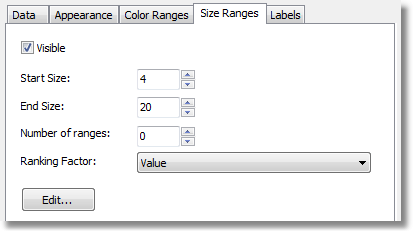
The size ranges have the following properties: min value, max value and size (in pixels). You can use as many ranges as you need. Set the number of ranges first and then set the properties for each range.
By default all range properties are set to "Auto", meaning FastReport calculates the minimum and maximum values for each range automatically. The auto size is chosen from two presets ("Start size", "End size"). The "Auto" mode may be suitable in most cases.