Continuous highlighting
As well as the conditional cell highlighting described above, FastCube can also apply four different types of highlight known as continuous highlighting, which applies highlighting to all cells dependent on their values. Each type of continuous highlighting is described below.
Two color scale and
Three color scale
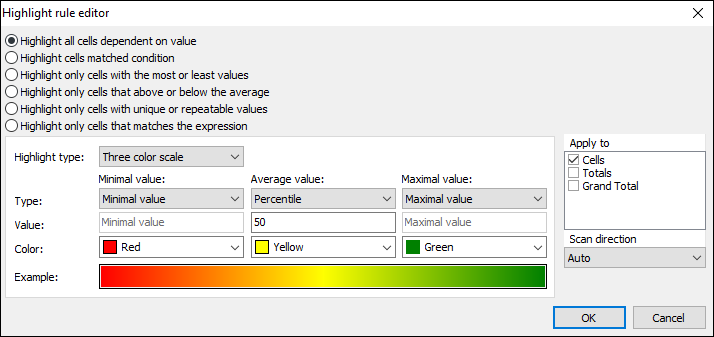
Color scale highlighting fills each cell's background with a color calculated from the given color gradient scale. The editor dialog sets the values for the extreme points and their corresponding colors, and also for one intermediate point for the three color scale. The values for the points can be set either as absolute numbers ("Number" option) or as one of the following relative options:
- Minimum by row/column - minimal measure value in row/column
- Percent by row/column - value field sets the percent relative to minimal and maximal measure values in row/column
- Percentile by row/column - value field sets the percentile relative to measure values in row/column
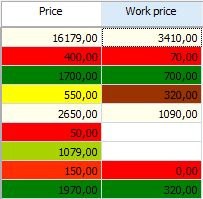
An example of two color and three color scale highlighting:
- Bar
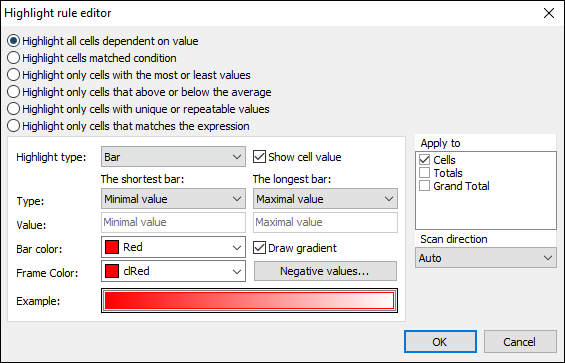
This type of highlighting draws a colored bar within the measure cell. The length of the bar depends on the values set under the Shortest bar and the Longest bar properties. The property values, as previously, can be set with either the absolute or the relative option. The bar can be drawn either in a solid color or with a gradient color to white. The frame color for the bar is set independently. The cell value can also be hidden for this type of highlighting, leaving only the bar visible.
An example of bar highlighting with and without visible cell values:
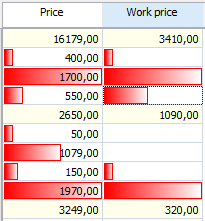
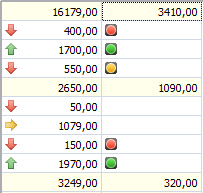
- Icon set
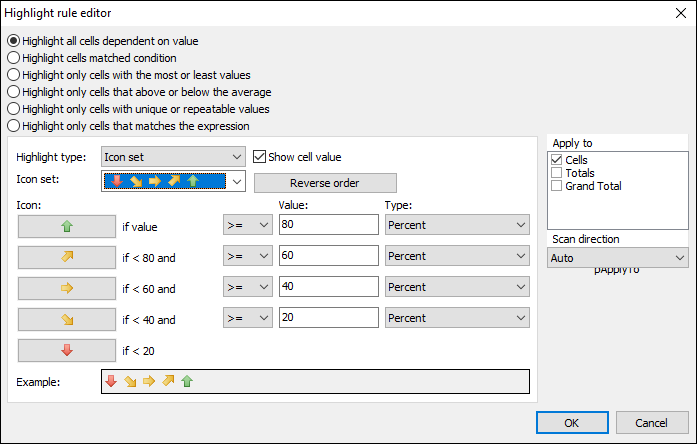
In Icon set highlighting an icon related to the value inside the measure cell is drawn to the left of the cell's value. The editor dialog has options for sets of 3, 4 or 5 icons. Each icon used requires a value range to be set. The cell value can also be hidden for this type of highlighting, leaving only the icon visible.
An example of icon set highlighting with and without visible cell values: