Setting up the Grid Structure
The grid structure many be defined in several different ways: by code, by loading from a cube or scheme file or by manual setup by the user. This paragraph deals only with manual setup of the grid structure.
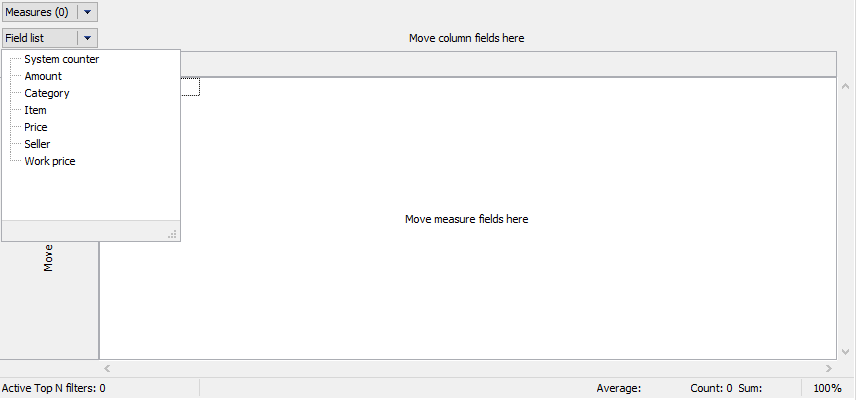
Dimensions and measures are added to the grid by dragging from the drop-down list (shown below) or by using the Field List dialog. They are added to one of the following regions:
- the filters region
- the row fields region
- the column fields region
- or the measure fields region (the data region)
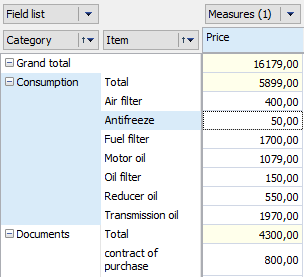
Let's add the fields "Category" and "Item" to the filters region, and drag the "Price" field to the data region. The grid now looks like this:
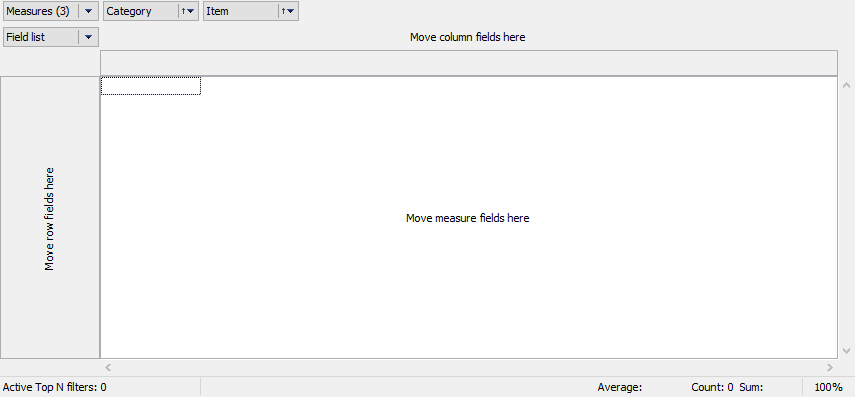
The number in brackets in the "Measures" dimension indicates the number of measures defined for this grid. Here the number of measures is 1, since we dragged the "Price" field to the data region. The "Measures" dimension is in fact not a simple dimension. Unlike all the others, "Measures" contains measures, and not elements of the database row as its values. This implementation of the measure list as a pseudo-dimensions allows a consistent approach in the user interface - dragging to any dimension region and value filter.
No data is yet displayed in the grid above as the grid only displays data when it contains at least one measure and the "Measures" dimension is located either in the row fields region or in the column fields region.
For example, if the "Category" and "Item" dimensions are dragged into the row fields region and the "Measures" dimension into the column fields region, then the grid will look like this: