The Chart
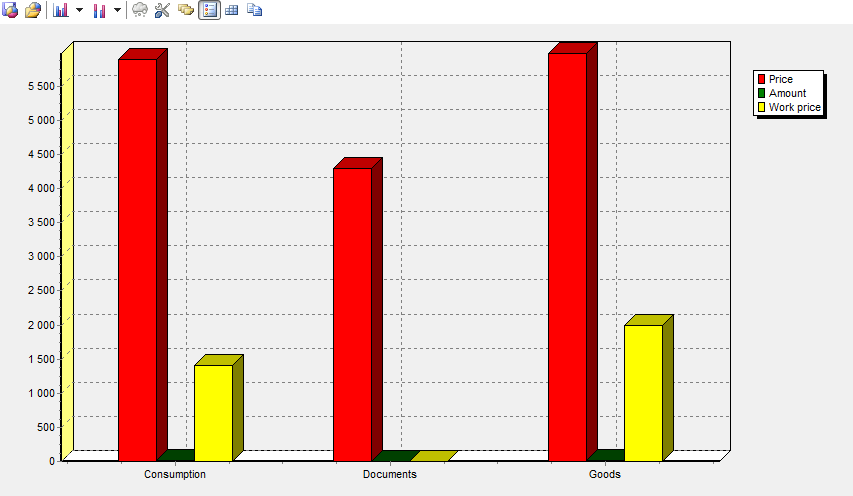
The data in a grid may be presented as a cumulative 2D chart. The TeeChart component is used for display of the chart. Depending on the settings, one of the major dimensions of the rows/columns is used for the chart series and the opposing dimension (i.e. the major dimension in the columns/rows) is used to supply the values in each of the series.
If the source grid does not contain row or column dimensions, an internal representation of a grid with row and column dimensions will be built inside the chart. The chart properties dialog is opened from the toolbar:
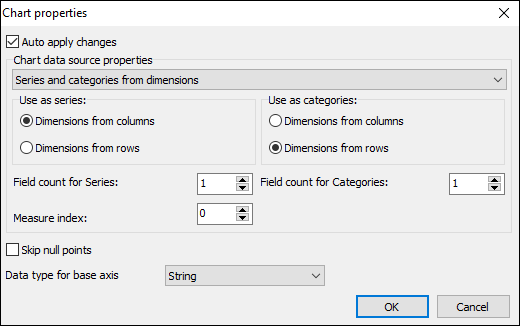
The main property is the source of data for the series and categories. Possible sources are: the dimensions and the measures in the grid. The dimension region, number of dimensions for the names of categories/series and the measure index need to be selected appropriate to the selected source.