A few theory
Let us look at the elements of a matrix:
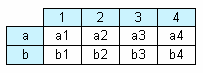
In the figure, we see a matrix with 2 rows and 4 columns. Here a, b - row header, 1, 2, 3, 4 - column header, a1...a4, b1...b4 - cells. In order to build such a report, only one data source will be needed, which has got 3 columns and contains the following data:
a   1   a1

a   2   a2

a   3   a3

a   4   a4

b   1   b1

b   2   b2

b   3   b3

b   4   b4
As seen, the first column represents the matrix row, the second - matrix column, and the third - contents of the cells at the intersection of rows and columns with the indicated number. When creating a report, FastReport creates a matrix in the memory and fills it with data. During this, the matrix dynamically increases, if the row or column with the given number doesn't exist yet.
A header can have more than one level. Let us look at the following example:
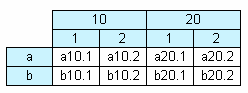
In this example, a column is compound, that is, it has got two values. This report requires the following data:
a   10  1   a10.1

a   10  2   a10.2

a   20  1   a20.1

a   20  2   a20.2

b   10  1   b10.1

b   10  2   b10.2

b   20  1   b20.1

b   20  2   b20.2
Here, the first column represents the row, the second and the third represent the matrix column. The last data column contains the value of the cell.
The next matrix element - subtotal and grand total, the next figure demonstrates it:
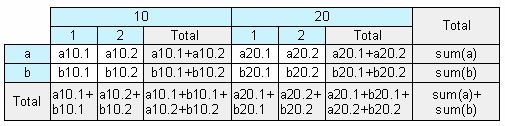
This report is built on the same data used in the previous example. Rows that shown grey in the figure, are calculated automatically.