Example 8. Objects in cells
Using objects inserted into matrix cells you can have various visual effects. We will show in the following example, how to draw a simple scale indicating employee's sales level.
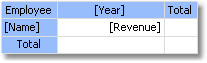
The matrix will use the "MatrixDemo" data source. To build a matrix, add data columns in the following way:
- add
Yeardata column to the row header; - add
Namedata column to the column header; - add
Revenuedata column to the matrix cell.
Set the appearance of the matrix in the following way:
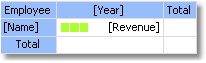
Now let us add three "Shape" objects to the cell with Revenue value.These objects will serve as indicators in the following way:
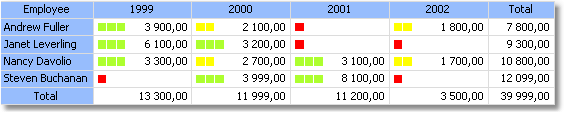
- if value in a cell is less than 100, only one object of red color will be shown;
- if value in a cell is less than 3000, two objects of yellow color will be shown;
- if value in a cell is more or equal to 3000, three objects of green color will be shown.
Now the matrix looks like this:
To control objects, we will use an event handler for a matrix cell. For this, select the Revenue cell, and create the BeforePrint event handler using the "Properties" window. Write the following code in the handler:
private void Cell4_BeforePrint(object sender, EventArgs e)
{
  // In our example, a cell has the Cell4 name.
  // Get cell value which is in the Cell4.Value property.
  // Some cells in our matrix will be empty. We'll take it into account (null check).
  // The value should be cast to decimal type, because data source column
  // [MatrixDemo.Revenue] is of System.Decimal type.
  decimal value = Cell4.Value == null ? 0 : (decimal)Cell4.Value;

  // Switch shape objects on or off depending on the value:
  // value < 100 - one object is visible;
  // value < 3000 - two objects are visible;
  // value >= 3000 - all objects are visible
  Shape1.Visible = true;
  Shape2.Visible = value >= 100;
  Shape3.Visible = value >= 3000;

  // Choose the color of objects:
  // value < 100 - red color;
  // value < 3000 - yellow color;
  // value >= 3000 - green color
  Color color = Color.Red;
  if (value >= 100)
    color = Color.Yellow;
  if (value >= 3000)
    color = Color.GreenYellow;

  // Set the objects' color
  Shape1.Fill = new SolidFill(color);
  Shape2.Fill = new SolidFill(color);
  Shape3.Fill = new SolidFill(color);
}
When we run the report, we will see the following: