Examples
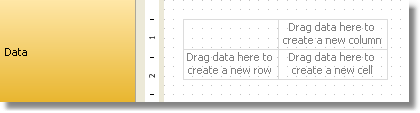
Let us look at examples of using the "Matrix" object. For a start create a new report and put the "Matrix" object on the "Report Title" band. You can also use the "Data" band - in that case there is no need to connect the band to a data source. In the given case, it does not matter on which of the two bands you will put the matrix, since both bands will be printed once when the report is started. The report looking as follows:
Do not put "Matrix" object on bands which will be printed on every new page - "Page header", "Page footer", etc. The matrix in this case will be created every time when the band will be printed, which will lead to stack overflow.
Most examples will be using the "MatrixDemo" table, which is bundled with the FastReport package. This table contains the following data:
| Name | Year | Month | ItemsSold | Revenue |
|---|---|---|---|---|
| Nancy Davolio | 1999 | 2 | 1 | 1000 |
| Nancy Davolio | 1999 | 11 | 1 | 1100 |
| Nancy Davolio | 1999 | 12 | 1 | 1200 |
| Nancy Davolio | 2000 | 1 | 1 | 1300 |
| Nancy Davolio | 2000 | 2 | 2 | 1400 |
| Nancy Davolio | 2001 | 2 | 2 | 1500 |
| Nancy Davolio | 2001 | 3 | 2 | 1600 |
| Nancy Davolio | 2002 | 1 | 2 | 1700 |
| Andrew Fuller | 2002 | 1 | 2 | 1800 |
| Andrew Fuller | 1999 | 10 | 2 | 1900 |
| Andrew Fuller | 1999 | 11 | 2 | 2000 |
| Andrew Fuller | 2000 | 2 | 2 | 2100 |
| Janet Leverling | 1999 | 10 | 3 | 3000 |
| Janet Leverling | 1999 | 11 | 3 | 3100 |
| Janet Leverling | 2000 | 3 | 3 | 3200 |
| Steven Buchanan | 2001 | 1 | 3 | 4000 |
| Steven Buchanan | 2001 | 2 | 4 | 4100 |
| Steven Buchanan | 2000 | 1 | 4 | 3999 |