Grouping the data
Sometimes we face a problem when series is filled with data with several identical X values. For example, the MatrixDemo table, which is used to demonstrate charts, has the following data:
| Name | Year | Month | ItemsSold | Revenue |
|---|---|---|---|---|
| Andrew Fuller | 2002 | 1 | 2 | 1800 |
| Andrew Fuller | 1999 | 10 | 2 | 1900 |
| Andrew Fuller | 1999 | 11 | 2 | 2000 |
| Andrew Fuller | 2000 | 2 | 2 | 2100 |
| Janet Leverling | 1999 | 10 | 3 | 3000 |
| Janet Leverling | 1999 | 11 | 3 | 3100 |
| Janet Leverling | 2000 | 3 | 3 | 3200 |
| ... |
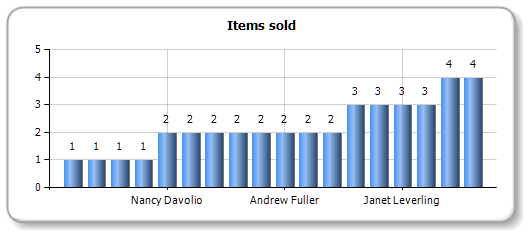
If we try to build a chart based on this data (for example, employee's sales - set X value to Name column, Y value to ItemsSold column), we will get the following wrong result:
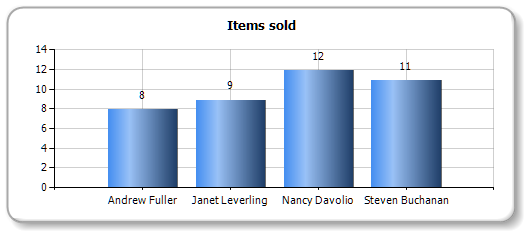
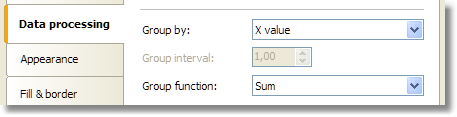
In this situation, we need to group the same employees into one value. To do this, select the series in the series list, and switch to the "Data processing" tab. Select the group type - "X value" and choose "Sum" as group function:
As a result, all identical employees will be grouped into one value, their sales will be summarized. You will see the following result: