Connecting chart to data
You can fill the chart with data in several ways:
- Use data source. To do this, you need to indicate the data source for the "Chart" object and connect each series to data columns.
- Use fixed values for each series.
- Fill the object with data using the script.
To connect the chart to a data source, follow these steps:
- select the "Chart" object in the series list;
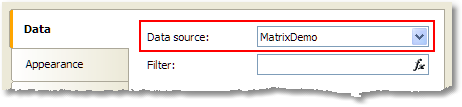
- switch to the "Data" tab;
- choose the data source:
- if necessary, set the data filter expression. This filter will be applied to all chart series;
- select the series in the series list;
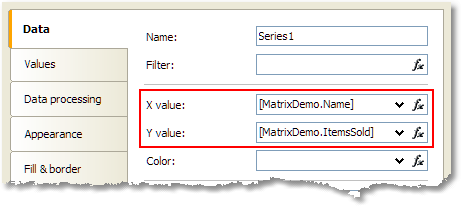
- switch to the "Data" tab;
- choose data columns for each series value. Depending on series type, it may have two or more values. Most series types have two values - X value and Y value:
- if necessary, set the data filter expression. This filter will be applied to current series only;
- in the "Color" control, you may indicate a data column which returns a color value.
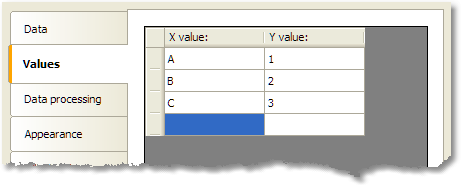
You may also provide list of values for the series. In this case, the data connection is not needed. To do this, select a series in the series list and switch to the "Values" tab. Fill the table with values: